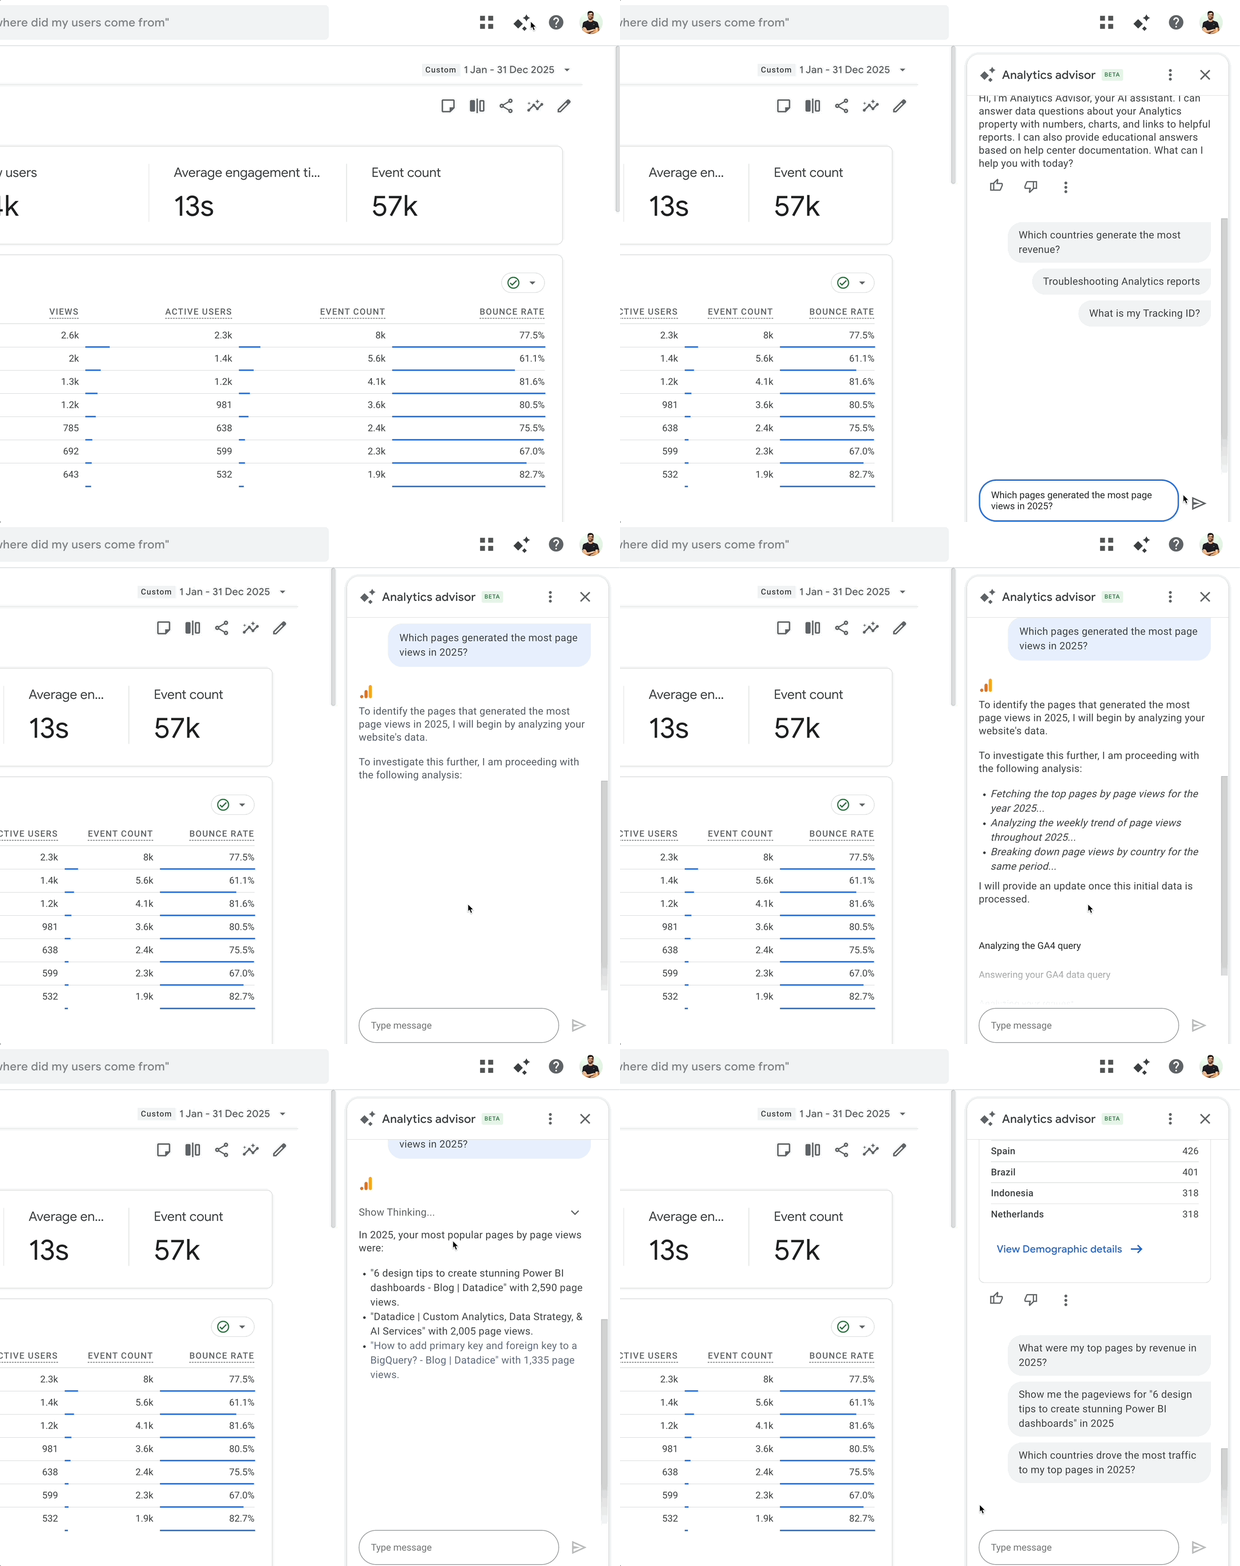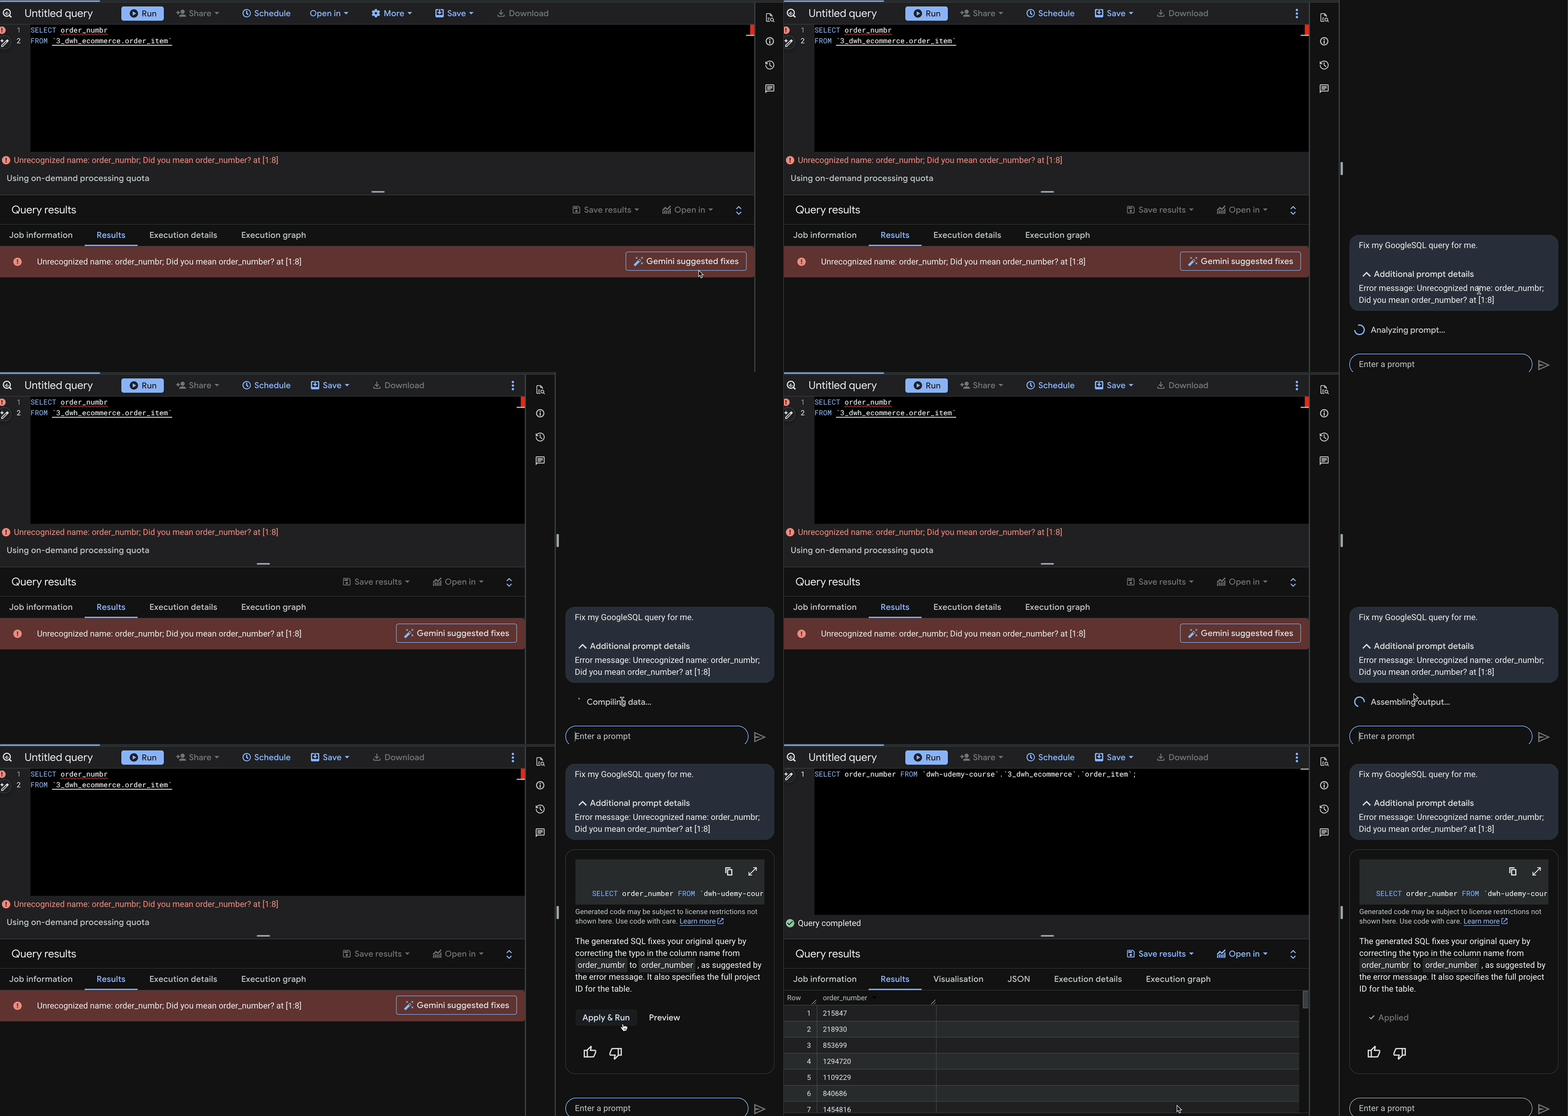
In this blog post, I want to summarize the new releases from the Google tools that we use daily in datadice. Therefore, I want to give an overview of the new features of BigQuery, Dataform, Looker Studio, Google Analytics, and Google Tag Manager. Furthermore, I will focus on the releases that I consider to be the most important ones, and I will also name some other changes that were made.
If you want to take a closer look, here you can find the Release Notes from BigQuery, Dataform, Looker Studio, Google Analytics & Google Tag Manager.
BigQuery
Flatten JSON Columns
In the data preparation section in BigQuery, you can now easily flatten a JSON Column. It is important that the column data type is JSON and not a STRING.
In the data preparation, you just need to click on the JSON column and then “Flatten”. If there are multiple levels in the JSON, just the first level gets flattened after the first click, but the new column can be flattened again.
 JSON data in data preparation
It is a good feature, because flattening complex JSON structures is always time-consuming, and using this feature (with Gemini support) is a useful tool.
Comments in BigQuery
There is the opportunity to add comments to notebooks, data canvases, data preparation, and saved queries now.
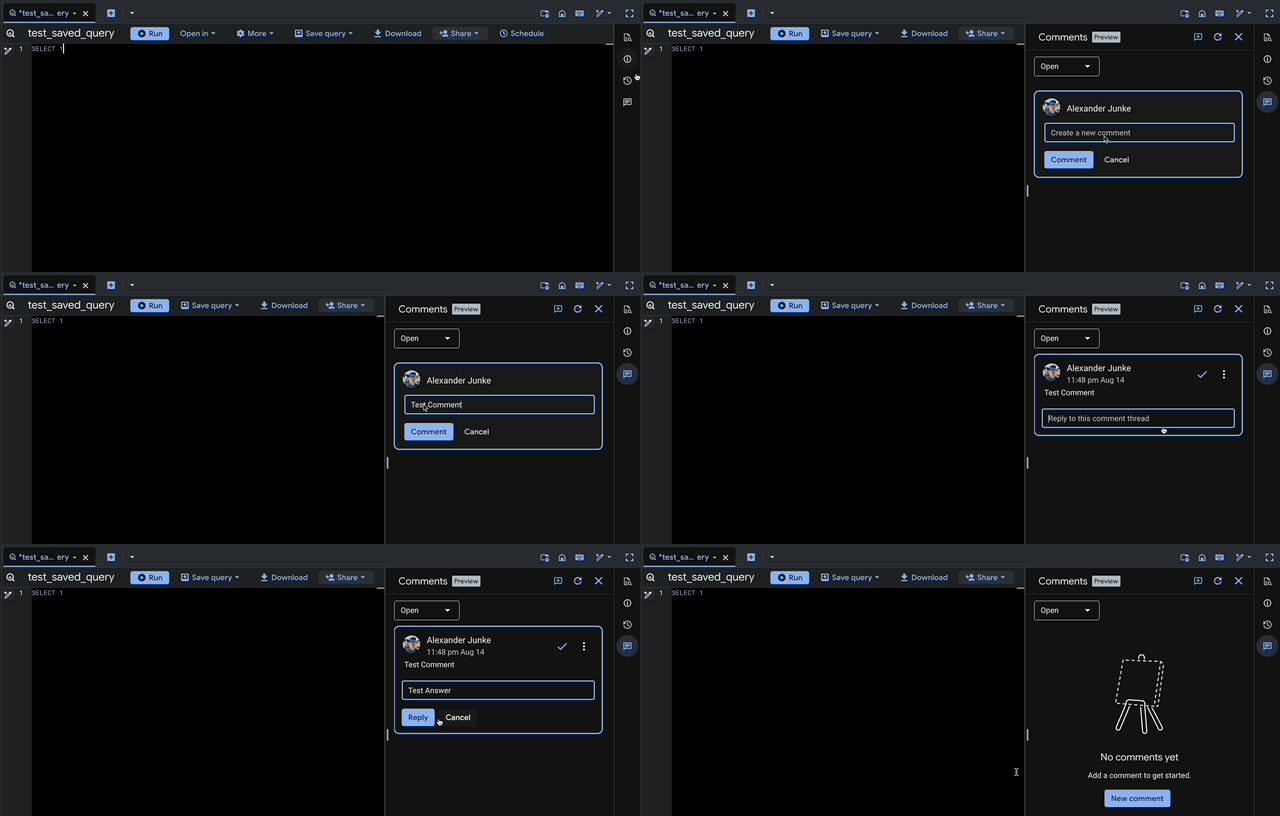 Adding a comment
The comment functionality is quite similar to the one in Google Docs, which is a good solution. You can easily switch to resolved comments as well.
However, it’s not possible to mark another person so that they receive an email. Hopefully, this will be added in an update in the future.
BigQuery ML models in UI
You can create BigQuery ML models completely in the user interface now. Just a dataset is needed, and you can create the ML model inside.
There is still the possibility to code everything, but the editor looks promising, and especially the short descriptions of the steps and choices could be really helpful.
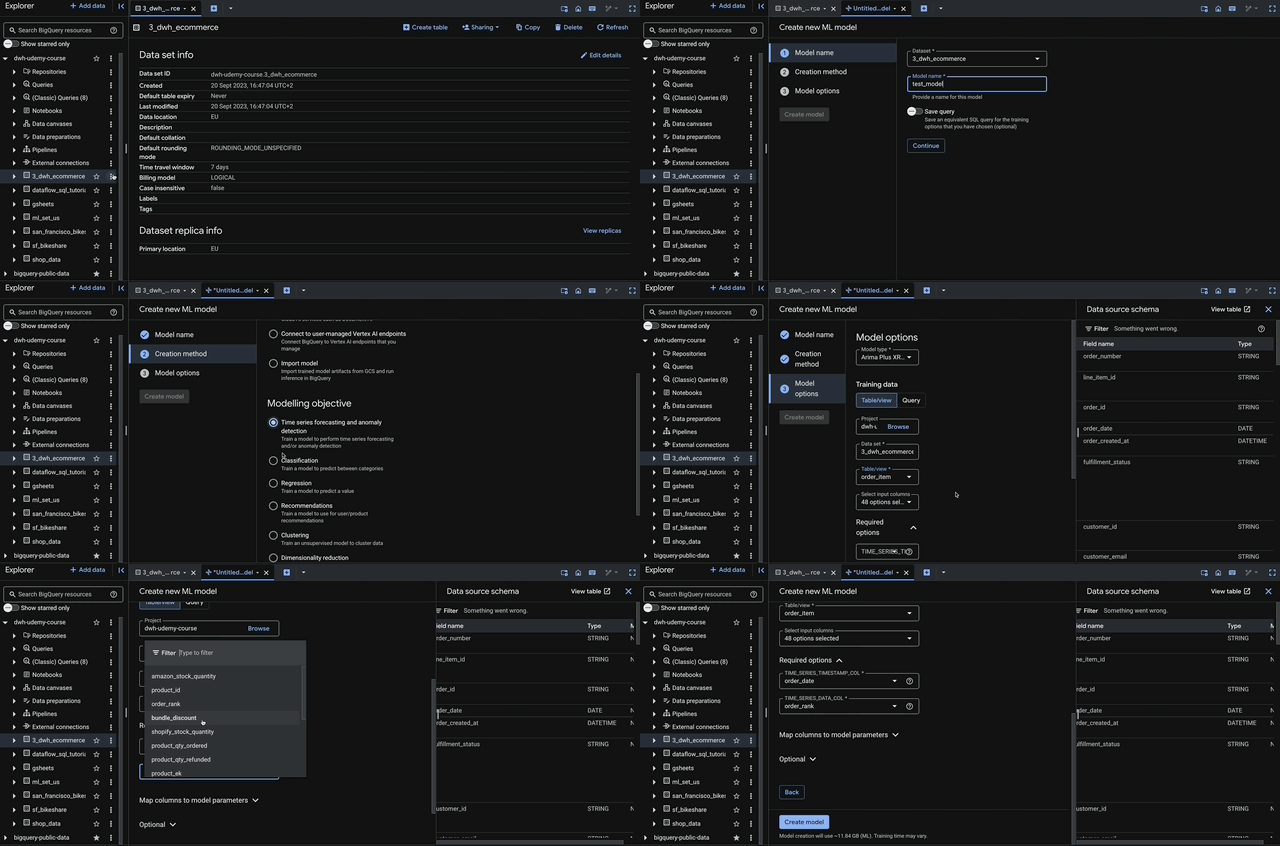 Implement a BigQuery ML model in the UI
Pipe Syntax improvement
The pipe syntax in BigQuery is another way to write SQL Code. You define every step, and the order of the statements defines the execution order. The statements are separated with the pipe symbol.
The pipe syntax got some new functionalities:
- DISTINCT
- WITH
- Names Windows
Example for DISTINCT:
(
  SELECT 'mercury' AS item, 1 AS position
  UNION ALL
  SELECT 'venus' AS item, 2 AS position
  UNION ALL
  SELECT 'venus' AS item, 2 AS position
  UNION ALL
  SELECT 'earth' AS item, 3 AS position
)
|> DISTINCT
|> WHERE position >= 2
|> WHERE position <= 4
Data Policies on columns
Next to Policy tags, you can also use data policies to restrict access to certain columns. There is a difference in how to assign these two kinds of restrictions:
- Data Policies: BigQuery Data Policy API or DDL statements
- Policy Tags: In the BigQuery UI
Here can be found how to create, update, and delete data policies.
Dataform
No further release for Dataform.
Looker Studio
New Alignment option
There is a new chart setting available in your Looker Studio reports. With the option “Align legend with grid” you can control if the legend alignment should be based on the chart title or chart grid.
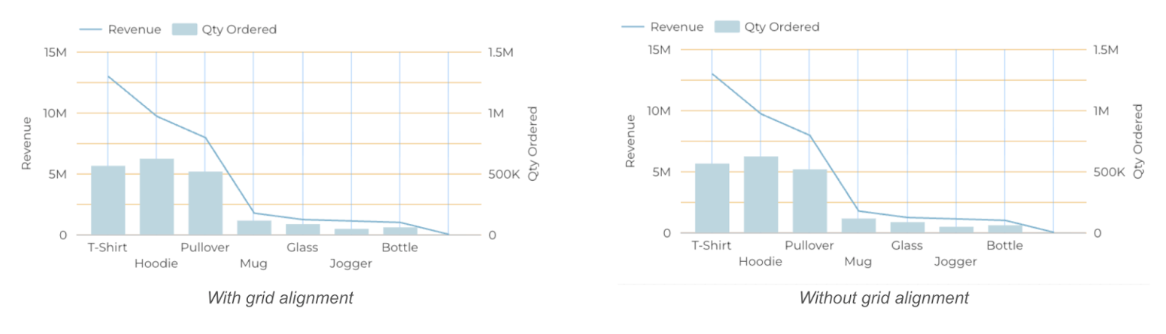 The different legend alignments
As standard behaviour, the setting is activated.
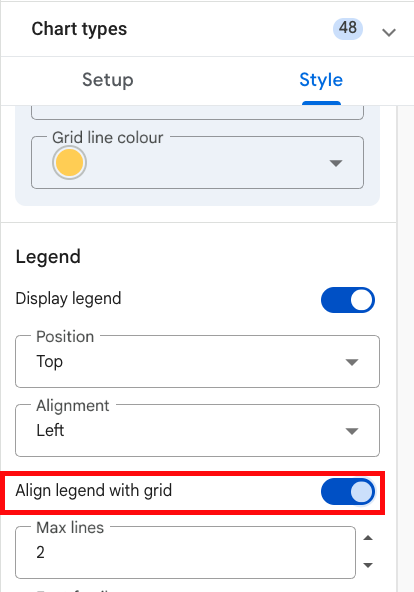 "Align legend with grid" option
Highlight Applied Filter
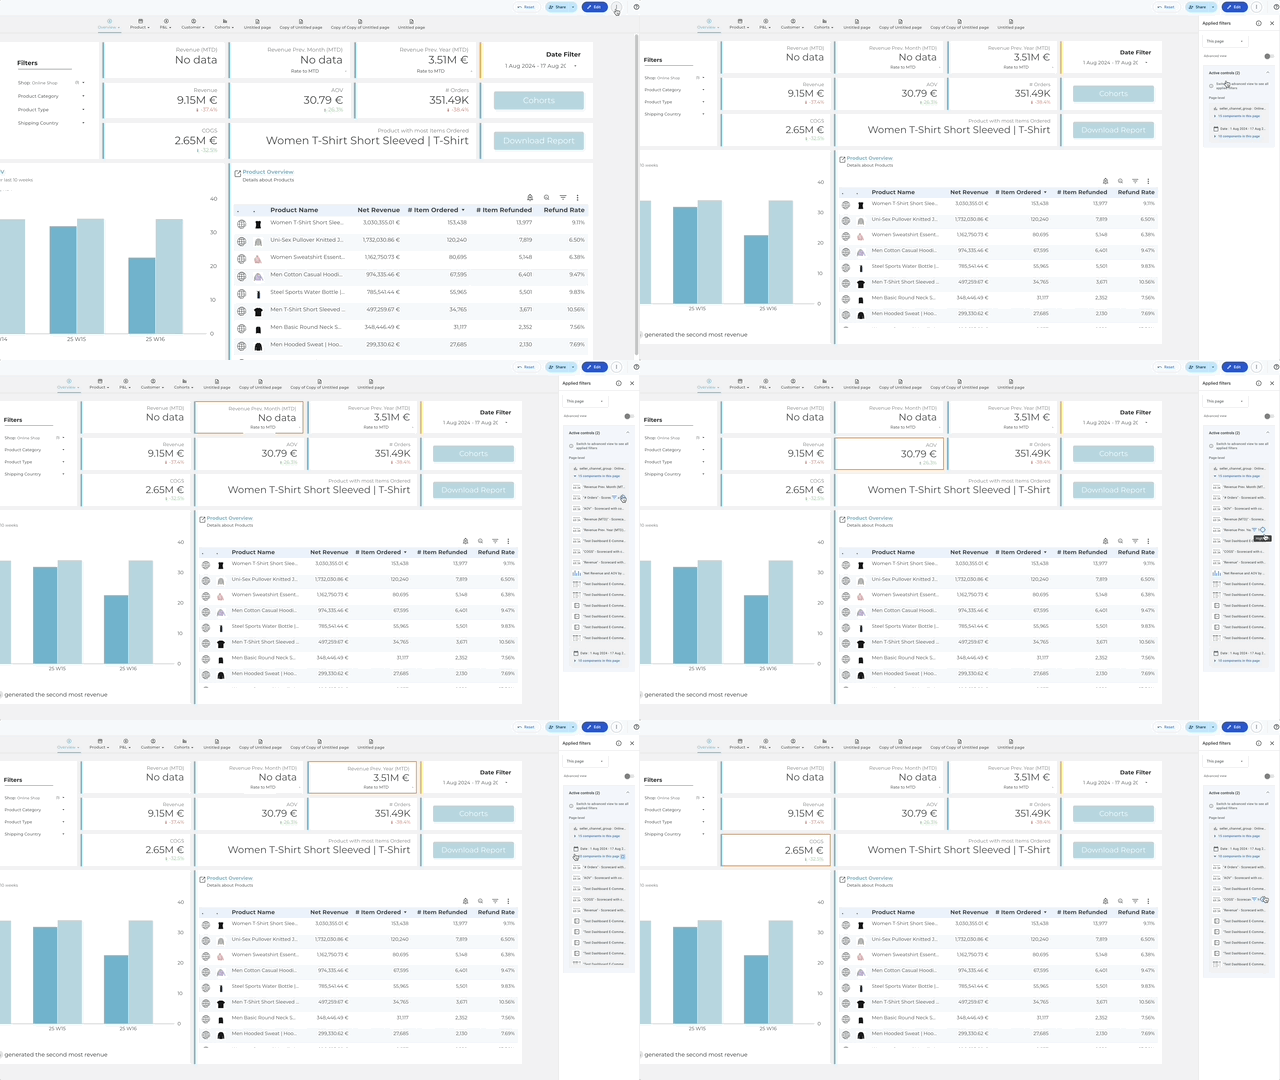
The menu “View applied filter” is really useful to see which filters affect which charts.
You can see all active filters on the page, or you can select one component and see which filters are active for it.
As a new feature, you can click on one component on “Highlight” and you see a coloured border on the chart to find it more easily.
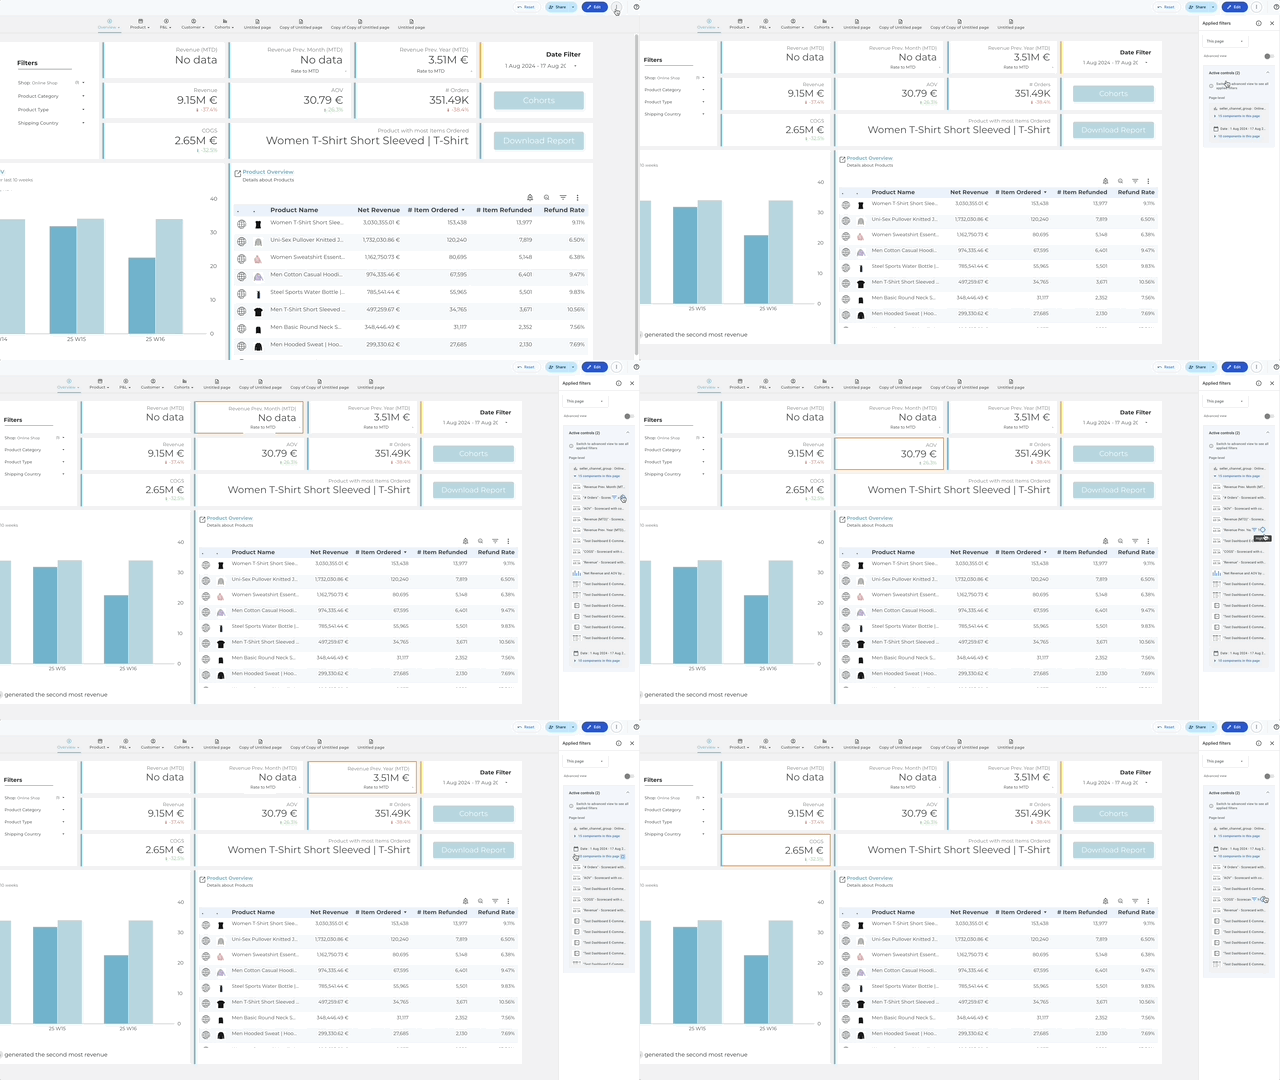 Highlight filtered components
Faster responses for BigQuery data
When your report uses BigQuery data sources, you may have already recognized an improvement in the report performance.
Because the connector can use the short query optimized mode. For small requests, it returns the results immediately and does not create a BigQuery job for it.
Important: This performance boost is only available when the datasource uses Viewers or Owner Credentials.
Small Changes
There are a lot of small changes that are important to mention:
- New size for report canvas: Size A4 (portrait or landscape)
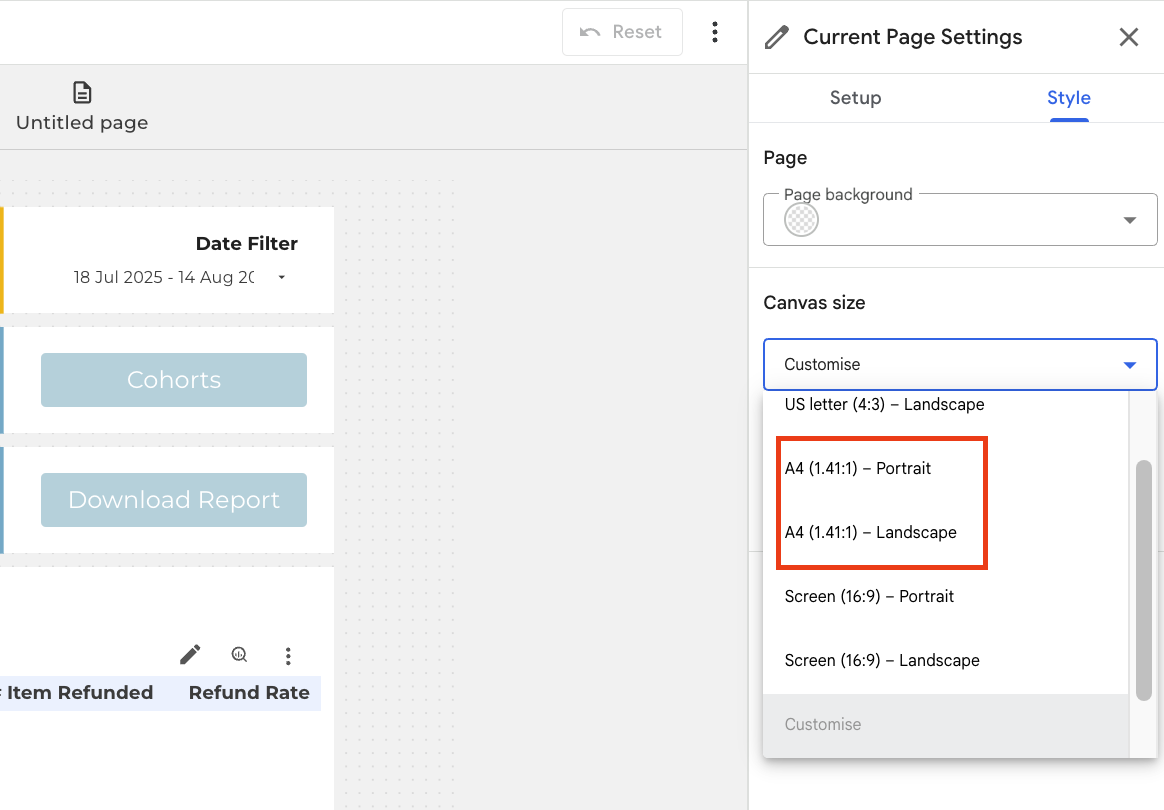 Choose the new A4 canvas sizes
- Adding alternative texts to an image (e.g. for a Screenreader)
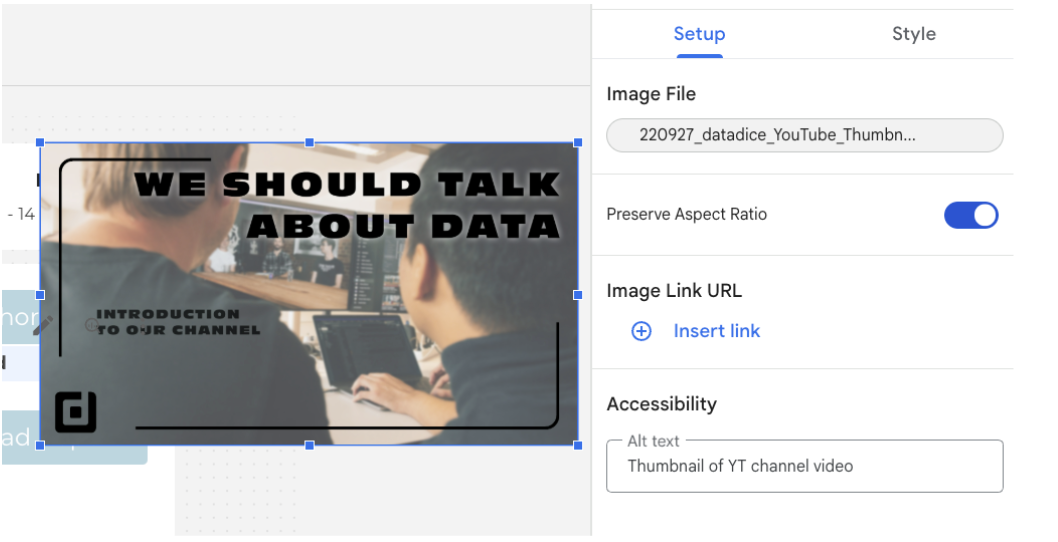 Add an alt text to an image
- Adding a report description, which is even used in report search and can be added in the edit mode of the report in the “3 dots menu” > “report details”
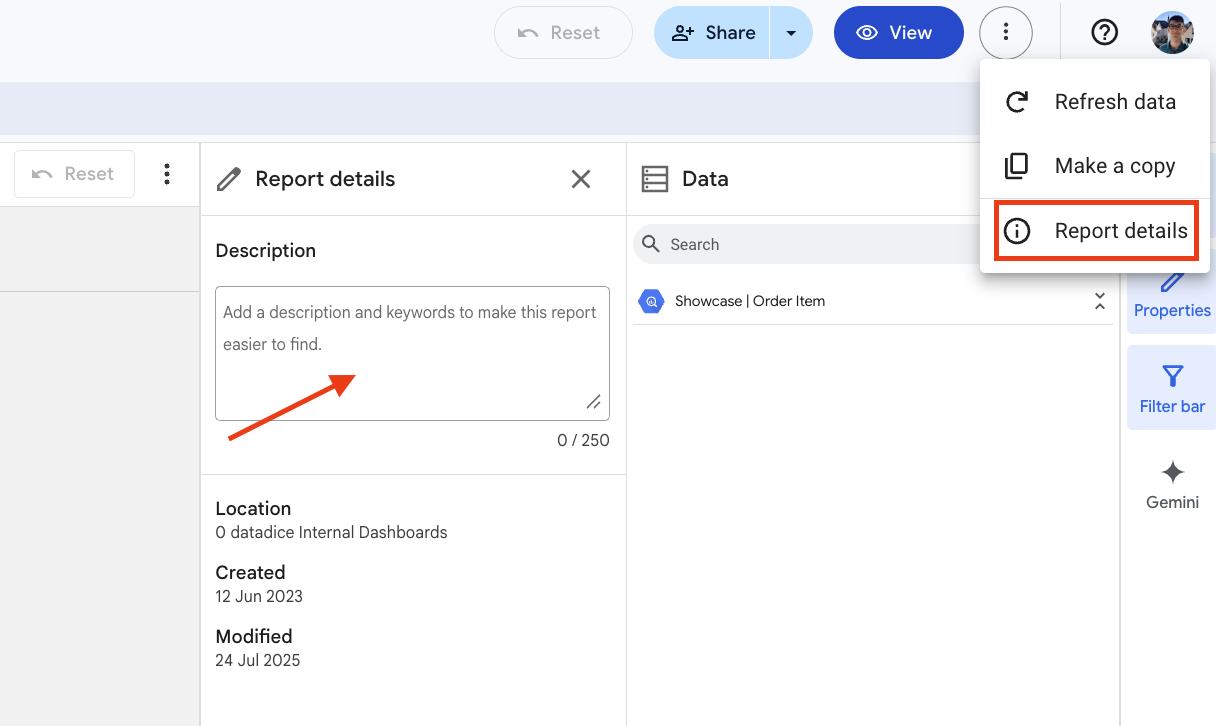 Add a report description
Google Analytics
Items data import
You can import item data to GA4, and now you can even upload item custom dimensions.
Before you upload the data, you need to create the custom dimensions in the property first.
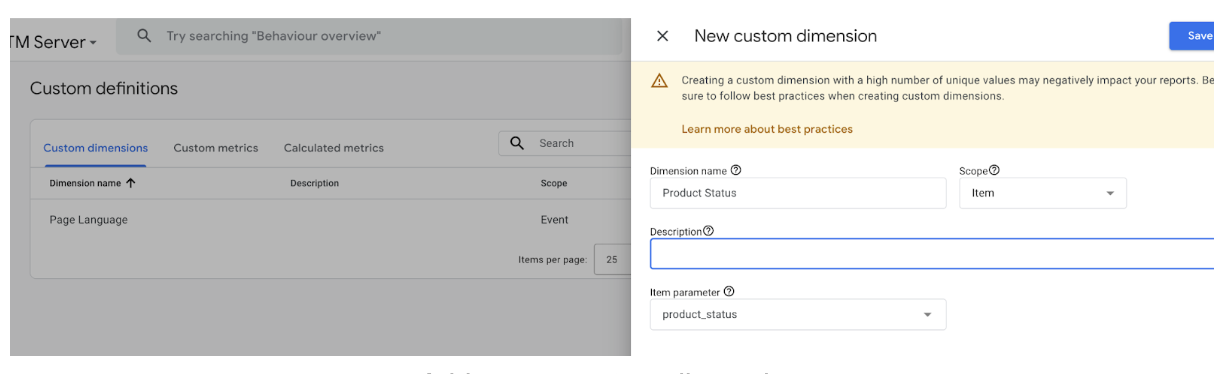 Add a new custom dimension
Then, under “Data import” you can import the item data via SFTP or CSV.
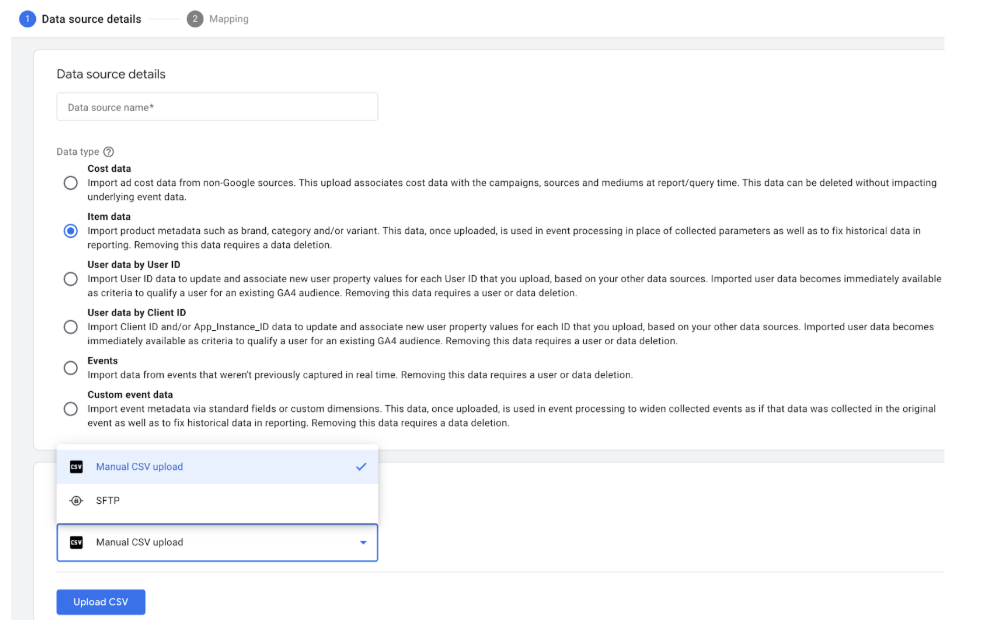 Update item data into the GA4 property
Import Reddit Ads data
You can import cost data from Reddit into your GA4 property.
How it works:
- Go to the Admin Section of your GA4 Property
- In the section “Data Collection and modification” click on “Data import”
- Write a name, select “Cost Data” (nothing else is available for Reddit), select the import source “Reddit”, and click on Connect
- Then go through the authorization steps, map the fields, and the connection is set up
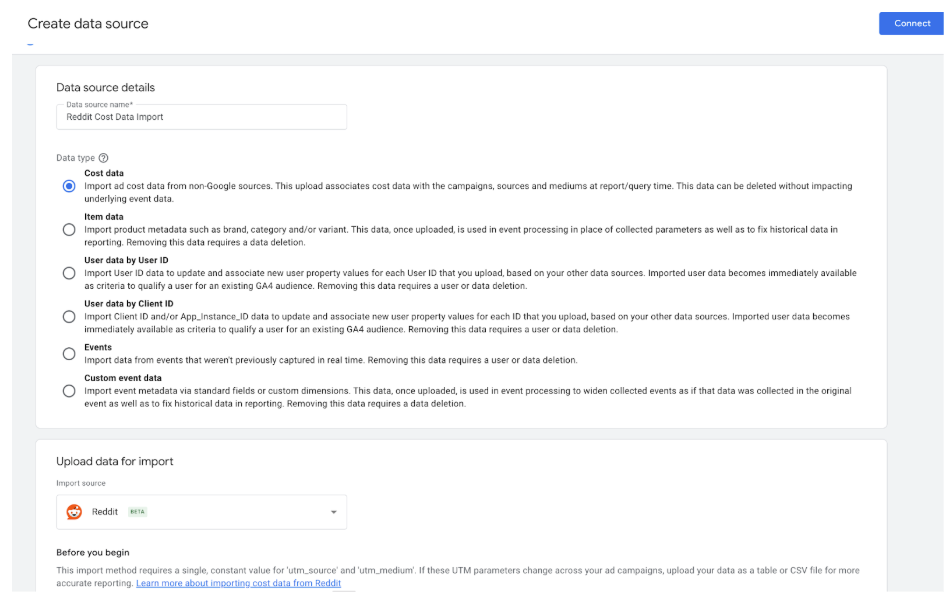 Select Reddit cost data import
New default reports for focus on lead generation
When you create the GA4 Property, you need to answer, what are your business objectives.
Depending on the answer, the default reports of your property changes.
There is a change when “Generate leads” is selected as the objective.
- Two new default reports: “Lead Acquisition” and “Lead Disqualification and Loss”
- New Lead Generation audience templates
Just to mention again, the reports just show data when the right events with the right structure get sent to GA4.
Note: You can also change the business objectives later in the GA4 property settings:
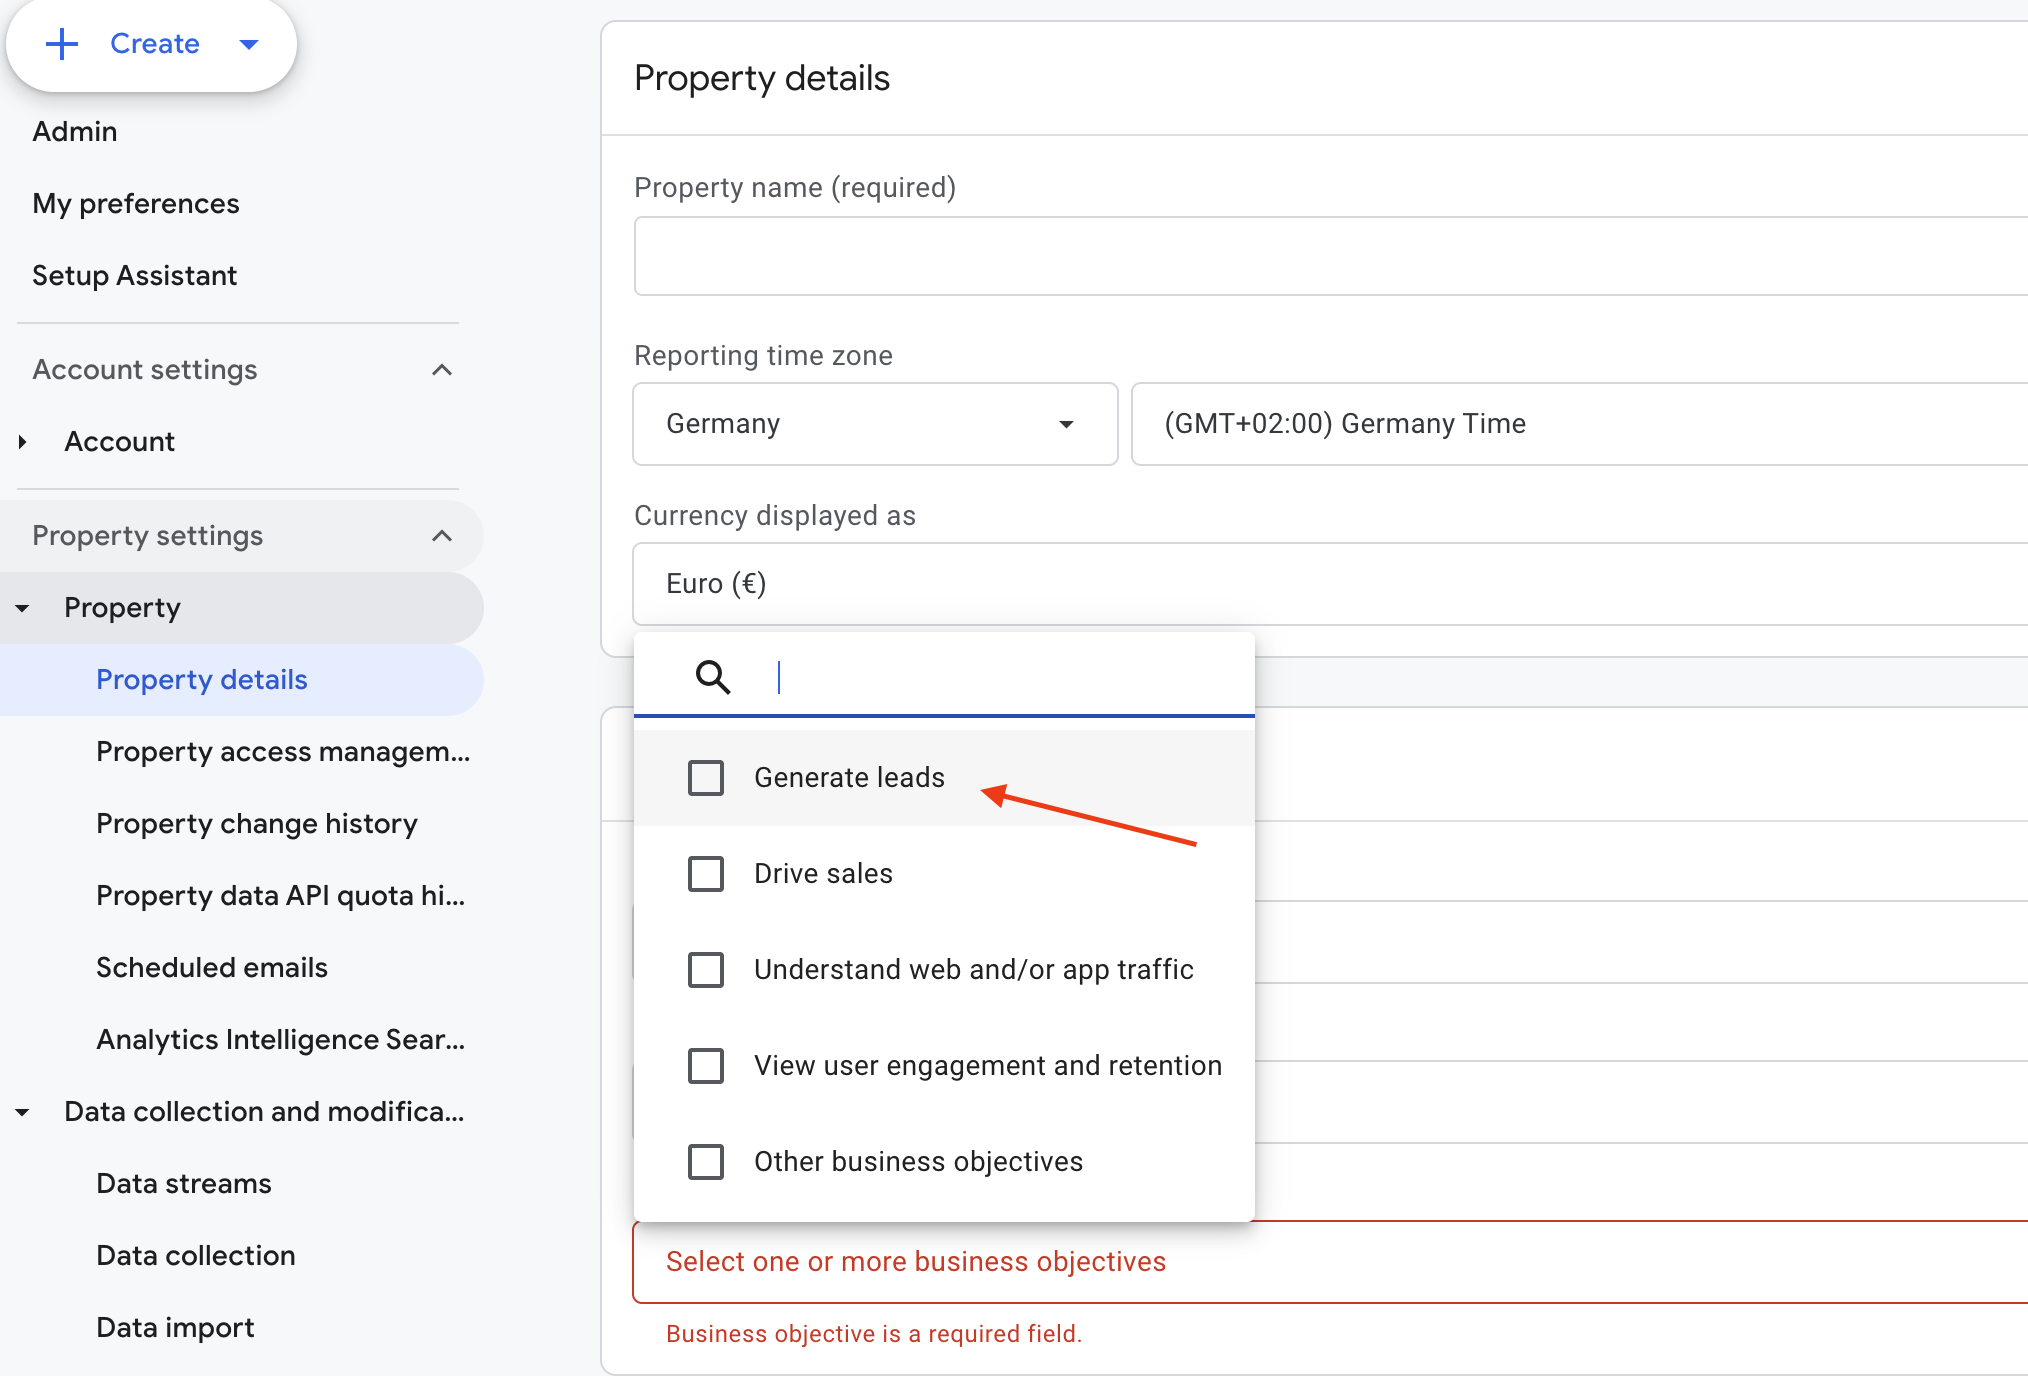 Change the business objectives
Google Tag Manager
Unconsented requests in Floodlight
When you configure the Consent State in your Client GTM Container and send this information to the Server Container, the Floodlight Tags also send unconsented requests to the Floodlight server.
Further Links
This post is part of the Google Data Analytics series from datadice and explains to you every month the newest features in BigQuery, Data Studio, Google Analytics, and Google Tag Manager.
Check out our LinkedIn account to get insights into our daily working life and get important updates about BigQuery, Looker Studio, and marketing analytics.
We also started with our own YouTube channel. We talk about important DWH, BigQuery, Looker Studio, and many more topics. Check out the channel here.
If you want to learn more about how to use Google Data Studio and take it to the next level in combination with BigQuery, check our Udemy course here.
If you are looking for help to set up a modern and cost-efficient data warehouse or analytical dashboards, send us an email to hello@datadice.io, and we will schedule a call.