In this blog post, I want to summarize the new releases from the Google tools that we use daily in datadice. Therefore, I want to give an overview of the new features of BigQuery, Dataform, Looker Studio, Google Analytics, and Google Tag Manager. Furthermore, I will focus on the releases that I consider to be the most important ones, and I will also name some other changes that were made.
If you want to take a closer look, here you can find the Release Notes from BigQuery, Dataform, Looker Studio, Google Analytics & Google Tag Manager.
BigQuery
New Transfers
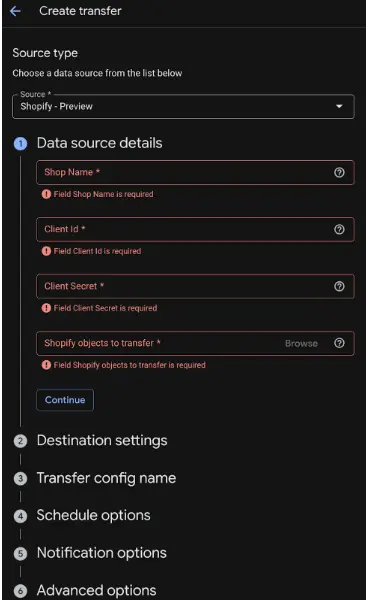
The BigQuery Data Transfer Service has added two new connectors, allowing you to ingest e-commerce and marketing data without custom pipelines. Shopify Data Transfer directly imports your store data into BigQuery.
- Data: Selectable objects like orders, products, customers, and inventory
- Requirements: Shop URL subdomain, Client ID, and Client Secret (via a Shopify app)
More information can be found here.
Mailchimp Data Transfer natively ingests email marketing data for analysis.
- Data: Objects including campaigns, lists (audiences), subscribers, and reports.
- Requirements: Mailchimp API Key.
- Configuration: You can optionally set a start_date to filter historical data
More information can be found here.
Gemini Cloud Assist
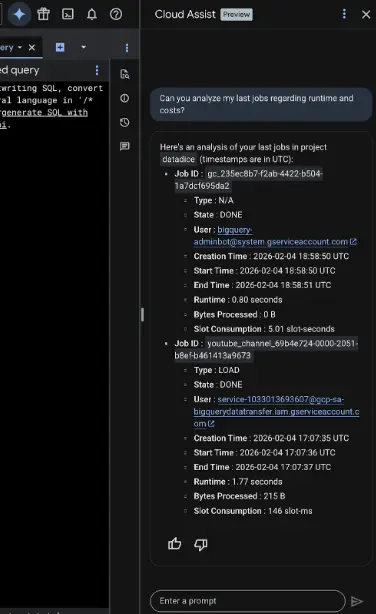
There are two useful updates for Gemini Cloud Assist in BigQuery, helping you both analyze past performance and find the right data assets within your projects.
- Job Analysis: You can ask questions to troubleshoot specific jobs, such as Why was my last query slow? Or why did this job fail?. You can also identify which queries were the most resource-intensive over a specific period.
- Resource Discovery: It is now possible to search for resources across your projects using natural language. For example, you can ask for a specific table's schema or find tables by content, such as Which tables contain demographic information about new users?
More information can be found here.
JDBC driver
A new, open-source Java Database Connectivity (JDBC) driver for BigQuery is now available. This Google-developed driver allows you to connect your Java applications and tools directly to BigQuery using standard database protocols.
This is particularly useful for integrating BigQuery into existing Java-based ecosystems, legacy applications, or third-party tools that rely on the generic JDBC standard rather than native Google Cloud client libraries.
To set it up, you need to
- Include the driver JAR in your project
- The connection is established using a URL pattern starting with jdbc:bigquery://
- Handle authentication, typically by providing a Service Account key or using Application Default Credentials
While it fully supports standard SQL execution, keep in mind that JDBC is generally synchronous. For high-throughput streaming ingestion or complex asynchronous jobs, the native BigQuery API might still be the better choice.
A detailed guide to setting it up can be found here.
AI function changes
You now have more control when using the AI.IF, AI.SCORE, and AI.CLASSIFY functions in BigQuery.
An optional endpoint parameter has been added, allowing you to specify a particular model for the function to utilize.
- Any generally available or preview Gemini model can be used
- If this argument is omitted, the function will choose the most fitting model (cost-to-quality tradeoff)
- The endpoint parameter works for all 3 functions the same
More information can be found here (e.g., for AI.Score).
Dataform
Structure Project with Dataform API
Google has introduced the ability to organize code assets into a hierarchical structure using the Dataform API. This update allows users to manage their development environment more effectively by grouping related resources into folders and repositories.
To utilize this feature via the Dataform API, follow these steps:
- Access the Dataform API through e.g. the Google Cloud SDK
- Use the folders resource to create a logical directory structure within your repository
- Move existing code assets or create new ones within these specific folder paths to maintain a clean workspace
- Manage permissions and access levels at different levels of the hierarchy as needed for your team
Here is an example of how to create a folder nested within another folder:
curl -H "Authorization: Bearer $(gcloud auth print-access-token)" \
 -H "Content-Type: application/json" \
 -X POST \
 -d '{
     "displayName": "folder_name",
     "containingFolder": "projects/project_id/locations/europe-west3/folders/parent_folder"
 }' \
"https://dataform.googleapis.com/v1beta1/projects/project_id/locations/europe-west3/folders"
More information about the whole permission controlling and more code examples can be found here.
Looker Studio
Filtering across data sources
We already wrote a Blog Post about this trick in 2021! Here you can find it.
It is possible to filter fields from different data sources with the same control. The solution we explained in the blog post is more like a “hack” because it was not natively supported. And now a separate menu can be used for this.
In the menu Resource > “Manage field names and IDs” you can enable these field overrides.
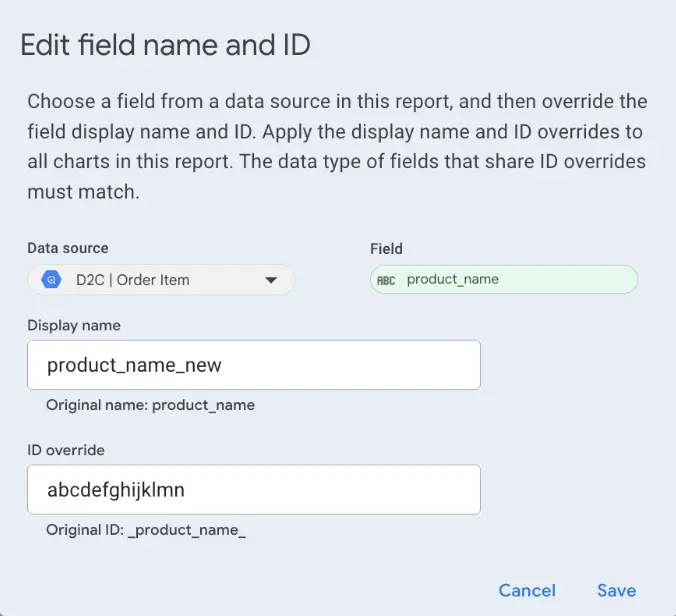
Note: Changing the field ID for a field that is already in use will break the charts. You need to select the new field in the broken charts, then.
And ensure that all fields with the same field id have the same data type.
Hide charts and components for viewers
A new meaningful feature allows you to control the visibility of individual charts, shapes, and other components within your reports. You can now choose to hide specific elements so they remain visible to editors in Edit mode but disappear for users in View mode.
This feature just really works when at least one editor of the dashboard has a Looker Studio Pro account.
How it works:
- Click on the three-dot menu of a chart
- Select the option “Control Visibility”
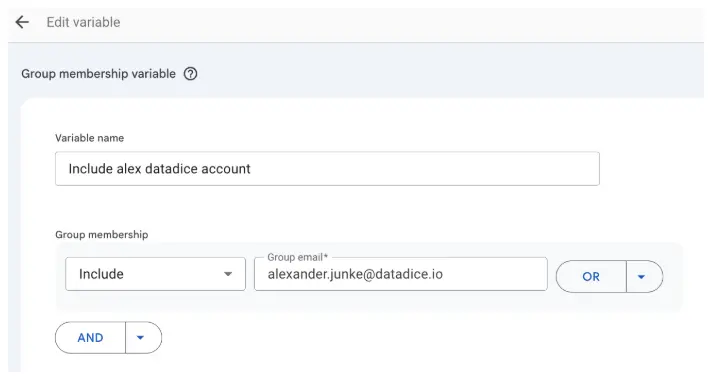
- Select an existing group membership variable (Pro user can create a new variable)
- Click on Confirm

If your account is part of the group membership variable, you still see the chart in the view mode. If not, you do not see the chart anymore when you are in the view mode.
There are two main use cases for this that I have currently in mind:
- Workflow Improvements: This is excellent for keeping "work in progress" charts in the report without exposing them to stakeholders.
- Internal Documentation: You can use this to add text boxes with instructions, change logs, or data quality notes that are only meant for the dashboard developers and not the end-users.
More information can be found here.
New Histogram charts
You can now visualize the distribution of your data natively using the new Histogram chart type. Unlike standard bar charts that compare specific categories, histograms group continuous data into intervals.
- Statistical Insights: This is essential for understanding the shape, center, and spread of your datasets, helping you spot outliers or skewness immediately.
- Use Case: A classic example is analyzing Session Duration or Order Value. Instead of just seeing an average, you can see exactly how many users fall into specific time or value ranges (e.g., 0-10s, 11-20s, etc.).
The configuration part is a bit confusing.
When you select the histogram, the “auto bin” option is active, and the categories are chosen from Looker Studio based on the distribution of the metric.
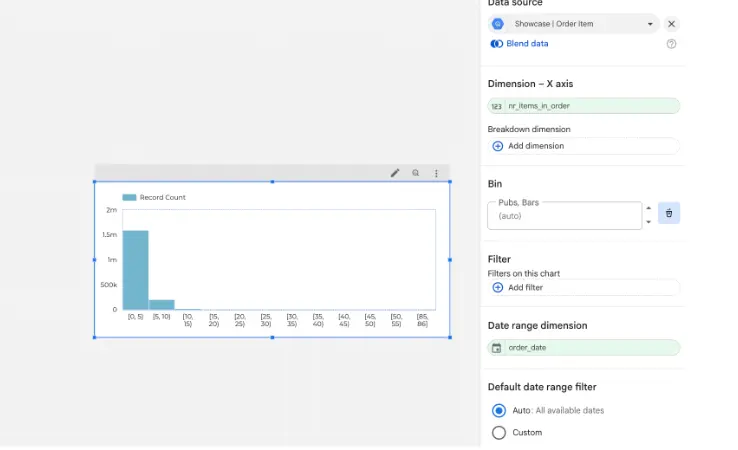
And then you can set up the number of bars yourself in the Bin section.
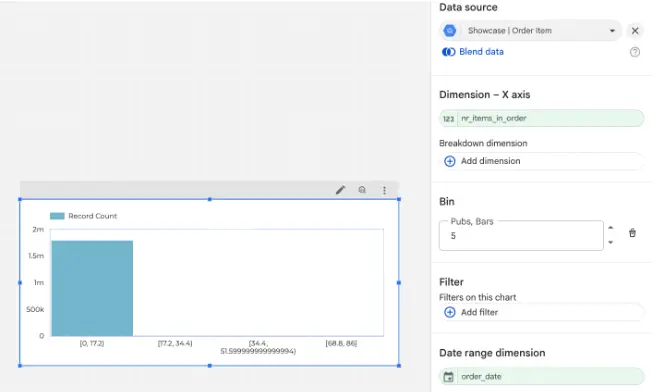
But the distribution of the bins does not work really well for a lot of fields. Then you need to set up the bins yourself by changing the calculation of the dimension.
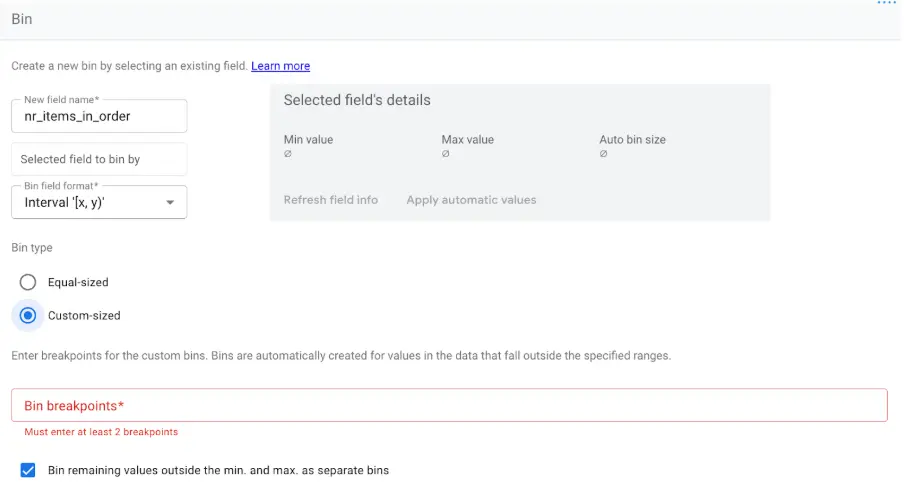
More information can be found here.
Google Analytics
Cross-channel budgeting
Google Analytics 4 is taking a big step towards becoming a comprehensive planning platform with the introduction of Cross-Channel Budgeting. This feature moves beyond retrospective reporting, allowing you to forecast performance and optimize media spend directly within the interface.
You can access this new toolset by navigating to Advertising > Planning > Budgeting.
The feature offers two main planning types
- Projection plans: help you monitor if your current campaigns are on track to meet your KPIs.
- Scenario plans: allow for "what-if" analysis, letting you simulate how different budget allocations would impact your future revenue or conversions.
There are some requirements before you can use the Cross-channel budgeting:
- You need at least one year of historical data for both conversions and campaigns.
- Data Requirements: Crucially, the model requires data from at least two channels, specifically covering both Google and non-Google sources. This means you will likely need to use Data Import to bring in cost and campaign data for your non-Google channels.
- Compatibility: The feature relies on your Primary Channel Grouping, and all channels must have associated cost data to be included in the plans.
Especially due to the requirement of “One year of cost data for non-Google integrations” I can not really try out this feature now.
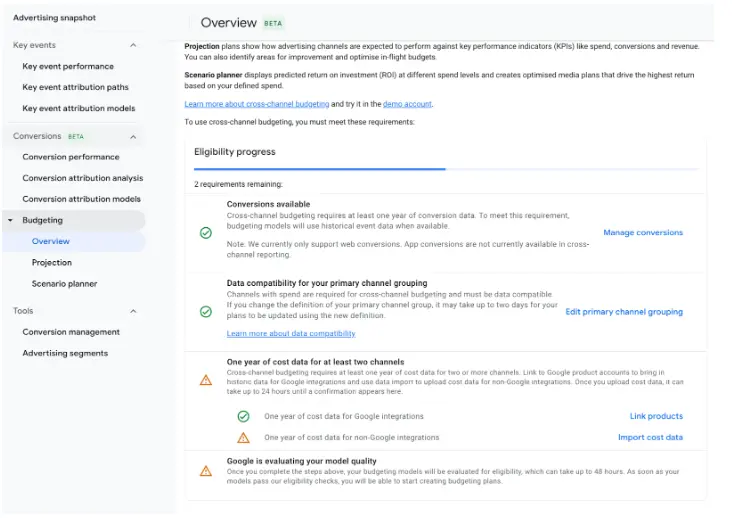
To get more information on how it works and what can be done, you can take a look here.
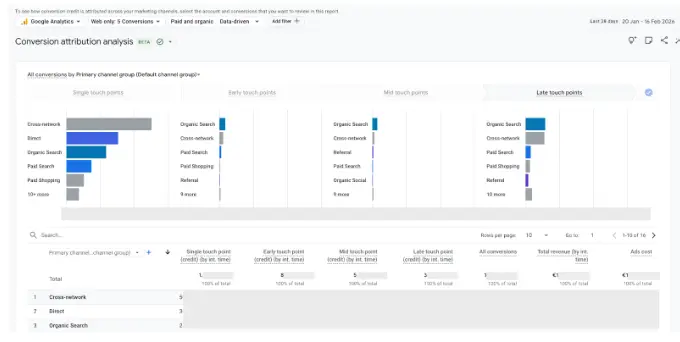
New report for conversion attribution
Google has introduced the Conversion attribution analysis report within the advertising workspace. This new tool is designed to uncover the full value of marketing channels throughout the entire customer journey.
The report offers two specialized views to provide deeper insights:
- Last Click: This view identifies channels that engaged customers early in their journey but were not the final click. It is particularly useful for justifying spend on upper-funnel channels like YouTube.
- Data-driven attribution: This view categorizes touchpoints into Early, Mid, and Late stages. It specifically separates single-touchpoint paths from multi-touchpoint journeys to distinguish between standalone drivers and campaigns that help close complex journeys.
To access the new report, follow these steps:
- Navigate to the "Advertising" workspace in your Google Analytics 4 property.
- Select "Attribution" and then click on "Conversion attribution analysis".
- Filter by specific conversion events or date ranges to analyze the performance of your upper and mid-funnel campaigns.
- Review the "Early", "Mid", and "Late" stage data to adjust your budget allocation towards high-impact touchpoints.
Some further options can be set up:
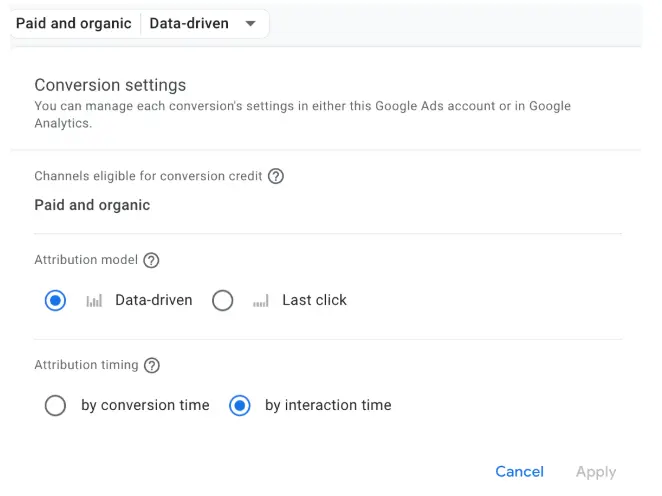
More information can be found here.
Google Tag Manager
Google tag gateway changes
There are 2 new small changes regarding setting up the Google Tag Gateway in GTM. You can configure the Google Tag Gateway in the Admin section of the Server container:
- Akamai can be selected as a CDN, next to Cloudflare
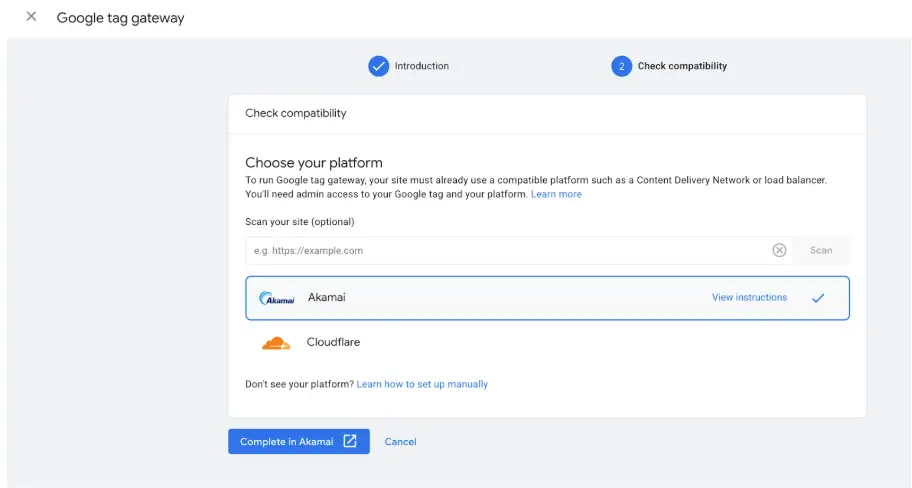
- Using GCP's Global external Application Load Balancer to set up the Google Tag settings
Further Links
This post is part of the Google Data Analytics series from datadice and explains to you every month the newest features in BigQuery, Data Studio, Google Analytics, and Google Tag Manager.
Check out our LinkedIn account to get insights into our daily working life and get important updates about BigQuery, Looker Studio, and marketing analytics.
We also started with our own YouTube channel. We talk about important DWH, BigQuery, Looker Studio, and many more topics. Check out the channel here.
If you want to learn more about how to use Google Data Studio and take it to the next level in combination with BigQuery, check our Udemy course here.
If you are looking for help to set up a modern and cost-efficient data warehouse or analytical dashboards, send us an email to hello@datadice.io, and we will schedule a call.