In this blog post, I want to summarize the new releases from the Google tools that we use daily in datadice. Therefore, I want to give an overview of the new features of BigQuery, Dataform, Looker Studio, Google Analytics, and Google Tag Manager. Furthermore, I will focus on the releases that I consider to be the most important ones, and I will also name some other changes that were made.
If you want to take a closer look, here you can find the Release Notes from BigQuery, Dataform, Data Studio, Google Analytics & Google Tag Manager.
BigQuery
Renamings
Google implemented significant naming changes across several data and analytics services. These updates primarily affect the user interface branding, while technical resources such as APIs, client libraries, CLI commands, and Identity and Access Management (IAM) roles retain their original names.
The key rebranding changes include:
- Dataproc to Managed Service for Apache Spark
- BigLake to Google Cloud Lakehouse (BigLake metastore has been renamed to the Lakehouse runtime catalog)
- Dataplex Universal Catalog to Knowledge Catalog
- Looker Studio to Data Studio (The website and endpoint have changed from lookerstudio.google.com to datastudio.google.com)
BigQuery Graph
BigQuery is a Graph database too now! And yes, it is worth its own blogpost!
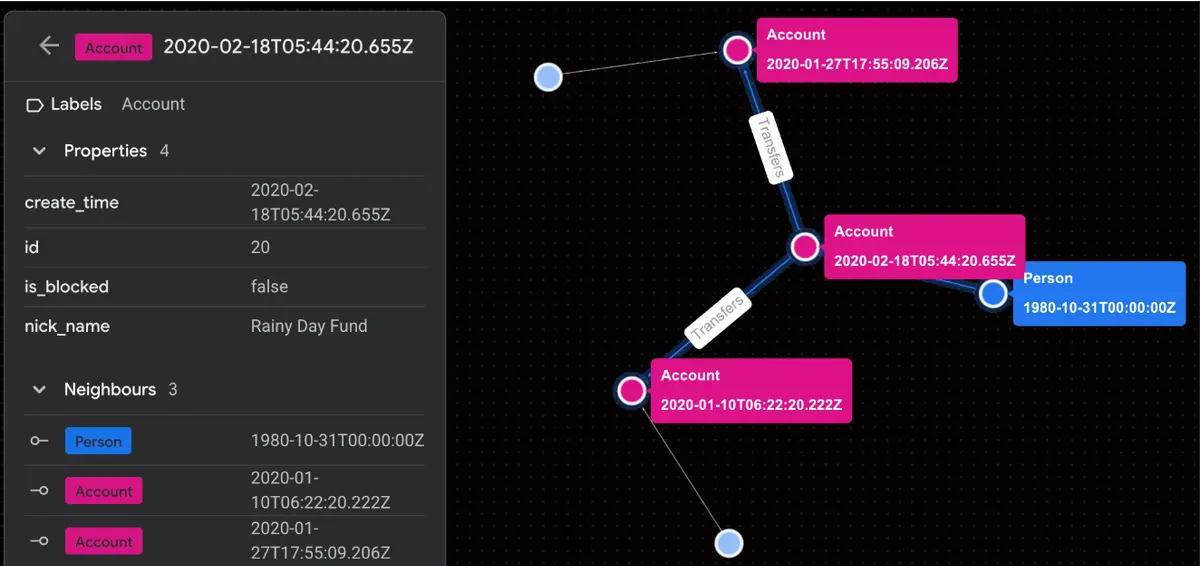
On a broad scale, you have the following opportunities:
- Create graphs directly from the existing tables
- Use the Graph visual modeler to build your graphs entirely in the UI
- Use GQL (Graph Query Language) to build up your Graph
- Visualize the Graph in a notebook or in BigQuery Studio
- Using Conversational Analytics on your Graphs
With GQL, you can do the following:
Setting up the nodes and edges of existing tables:
CREATE OR REPLACE PROPERTY GRAPH graph_db.FinGraph
  NODE TABLES (
    graph_db.Account,
    graph_db.Person
  )
  EDGE TABLES (
    graph_db.PersonOwnAccount
      SOURCE KEY (id) REFERENCES Person (id)
      DESTINATION KEY (account_id) REFERENCES Account (id)
      LABEL Owns,
    graph_db.AccountTransferAccount
      SOURCE KEY (id) REFERENCES Account (id)
      DESTINATION KEY (to_id) REFERENCES Account (id)
      LABEL Transfers
)
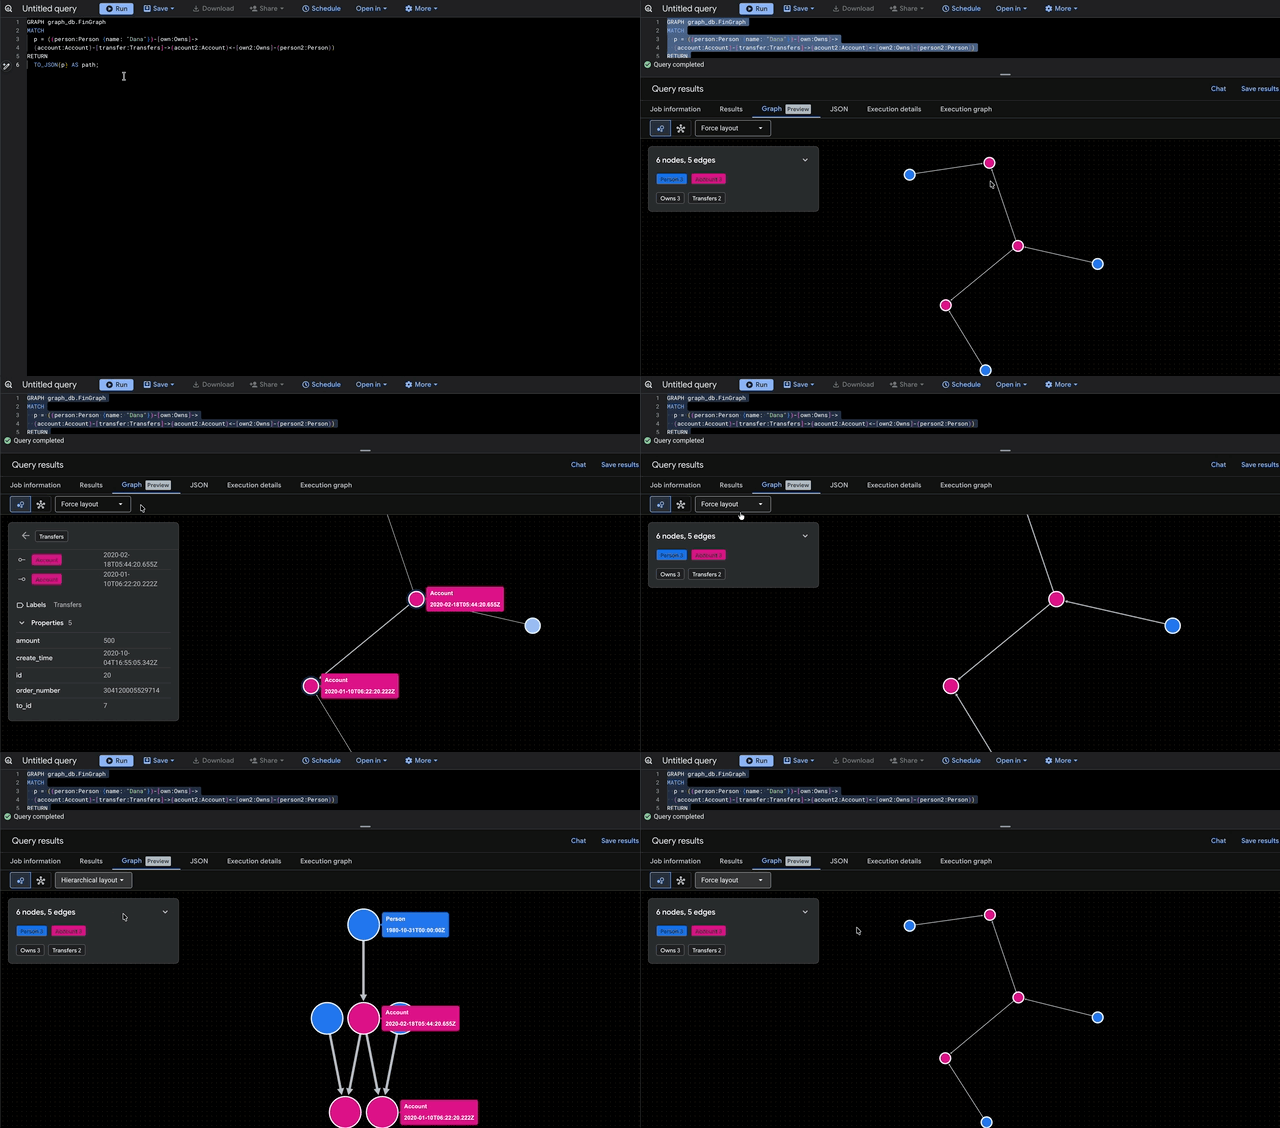
Querying the graphs and visualizing them:
GRAPH graph_db.FinGraph
MATCH
  p = ((person:Person {name: "Dana"})-[own:Owns]->
  (account:Account)-[transfer:Transfers]->(acount2:Account)<-[own2:Owns]-(person2:Person))
RETURN
  TO_JSON(p) AS path;
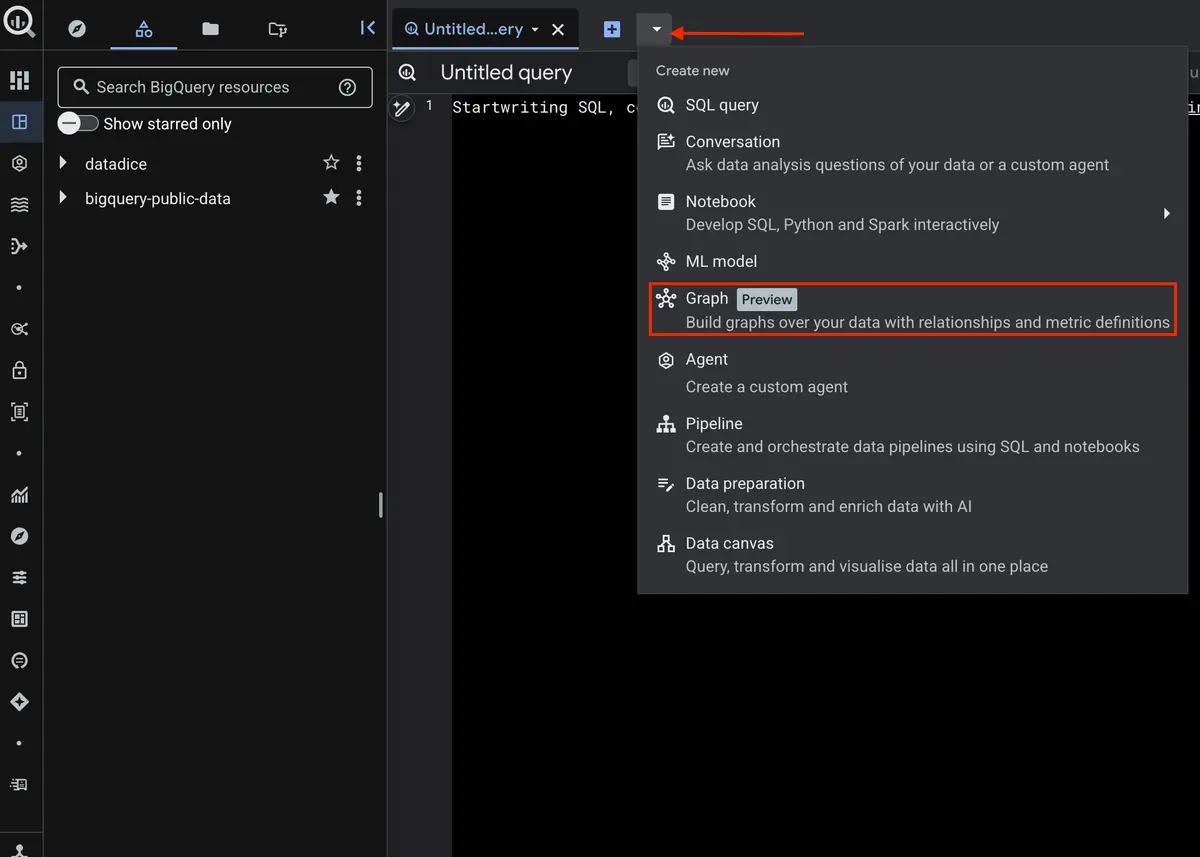
To create a Graph in the UI, you need to start here
But this topic is too huge to handle in a short section. The rest you need to find out on your own. Maybe we will write a separate blog post about it.
A starting point for further research can be found here.
Data Transfer improvements
The BigQuery Data Transfer Service has been enhanced to support incremental data transfers for a wider range of database connectors. This allows for just transferring new or updated records rather than pulling the entire dataset every time.
Incremental data transfers are now available for the following data source connectors:
- MySQL
- Oracle
- PostgreSQL
- ServiceNow
- Microsoft SQL Server
To configure an incremental transfer (example for MySQL):
- Navigate to Data Transfers in your BigQuery workspace
- Create a new transfer and select MySQL as the source
- During configuration, set up your connection and dataset details
- Choose the Ingestion type “Incremental”
- Decide if you want to use “Append” or “Upsert” as write mode
With the write mode “Append”, the updated row will be added to the table, and the old one remains. “Upsert” updates the original row, and the original values are gone.
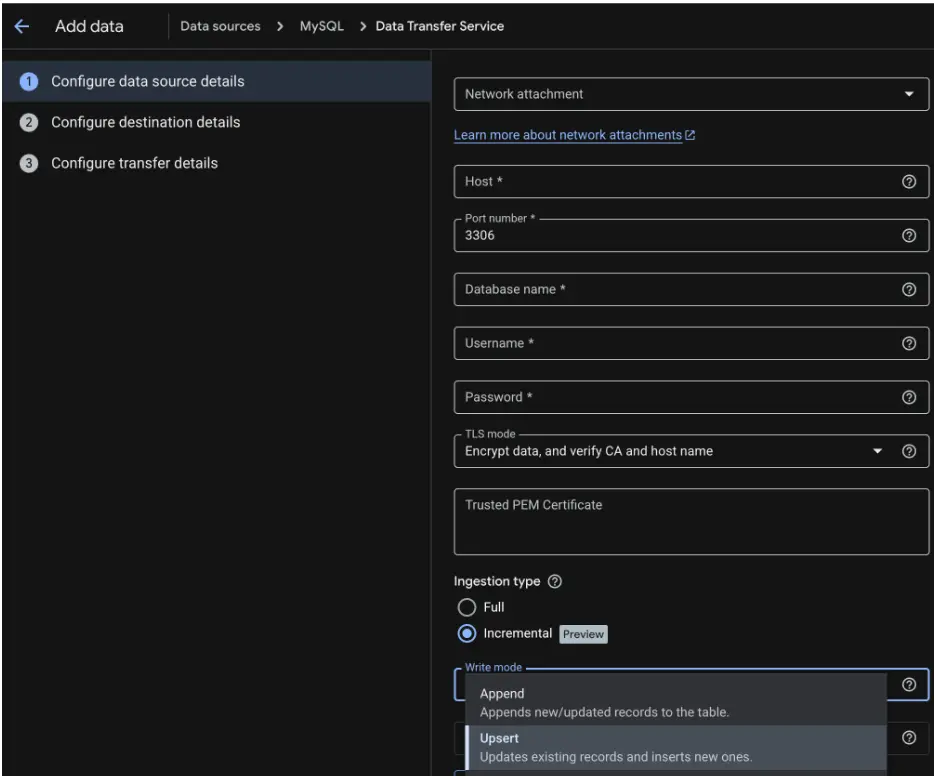
More information can be found here (Example MySQL).
New AI Function
Google has introduced AI.KEY_DRIVERS, a new function that performs contribution analysis directly within your SQL queries. This feature allows users to automatically identify data segments that drive statistically significant changes to a summable metric.
Prepare your data so that it includes your dimension columns, one numeric column containing the summable metric, and one boolean column that indicates whether a row belongs to the interest set (True) or the reference set (False).
An example of a query could be:
WITH InputData AS (
  SELECT
    product_gross_revenue_after_discount AS gross_revenue,
    product_name,
    seller_channel,
    billing_country,
    IF(order_date > '2023-07-01', TRUE, FALSE) AS date_after_h2
  FROM `dataset_name.order_item`
  WHERE EXTRACT(YEAR FROM order_date) = 2023)

SELECT * EXCEPT(product_name, seller_channel)
FROM AI.KEY_DRIVERS(
  TABLE InputData,
  metric_col => 'gross_revenue',
  dimension_cols => ['product_name', 'seller_channel'],
  interest_label_col => 'date_after_h2',
  min_apriori_support => 0
);
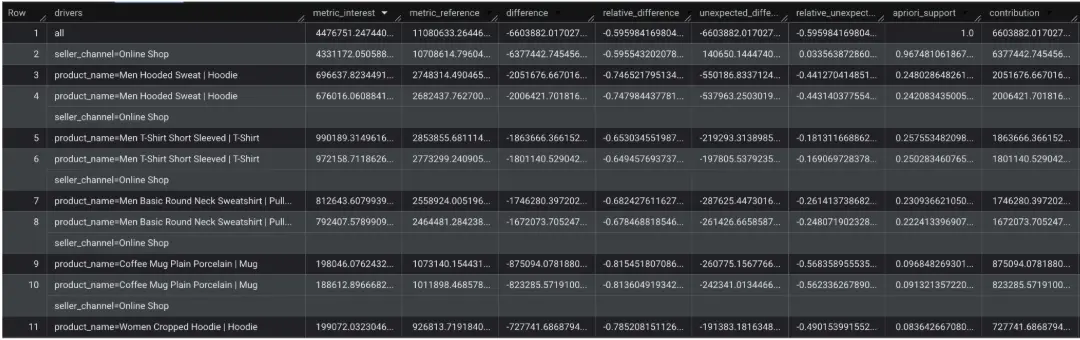
The function compares an "interest" dataset against a "reference" dataset to find unexpected differences and calculate the relative impact of specific segments (in our example H1 against H2 of 2023).
The function output provides a driver's array (the dimensions defining the segment) alongside detailed metrics such as metric_interest, metric_reference, difference, and unexpected_difference
The current limitations are the maximum of 12 dimensions, and it only works with summable metrics.
More information can be found here.
Python UDFs
Several enhancements to Python UDFs are available:
- Vectorized UDFs: You can now create vectorized UDFs utilizing the Apache Arrow RecordBatch interface
- Cloud Monitoring Integration: UDFs automatically export operational metrics such as CPU utilization and memory usage directly to Cloud Monitoring
- Concurrency Control: With the new container_request_concurrency option in the CREATE FUNCTION statement, you can set the maximum number of concurrent requests per container instance
- New Quotas: Python UDFs have some limits, including a maximum of 10 GiB for image storage and a mutation rate of 30 operations per minute
- Cost Visibility: Execution costs can be tracked using the external_service_costs column in the INFORMATION_SCHEMA.JOBS view and within the ExternalServiceCosts field in the Job API.
MFA for Google Ads Transfer
Starting 07.05.2026, the BigQuery Data Transfer Service for Google Ads will strictly require Multi-Factor Authentication.
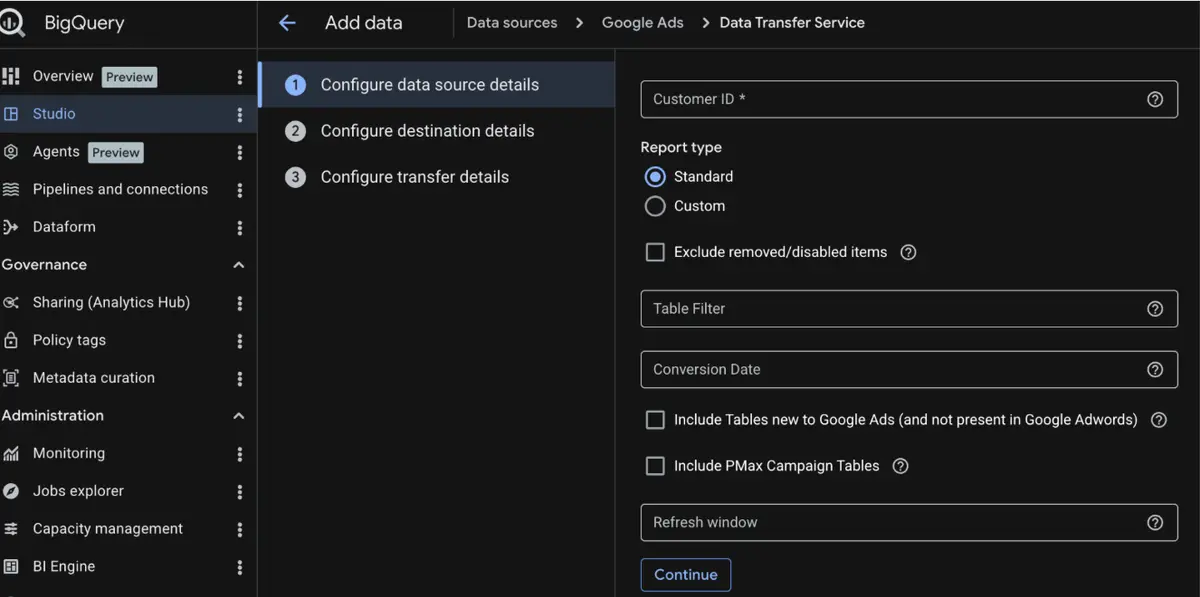
Key details regarding this update:
- Requirement for New Transfers: This policy applies only to new transfer configurations created after 07.05.2026
- Existing Transfers: Current and active transfer configurations are not affected by this change and will continue to run without immediate modification
- Exemption for Service Accounts: Transfers authorized via Service Accounts are exempt from this MFA requirement
- Security Compliance: Ensure that the user account used to set up a new transfer has 2-Step Verification enabled to prevent setup failures
More information can be found here.
Dataform
Developer Connect for Git
The connection process between Dataform and third-party Git repositories (such as GitHub or GitLab) has been significantly streamlined. With the Developer Connect integration, manual secrets management is no longer required, and Dataform can now support repositories located within privately hosted networks.
To implement this connection:
- Navigate to your Dataform project in the Google Cloud Console
- Open the Settings section and click on “Connect with Git”
- Select the option to connect a repository using Developer Connect
- Click on Repository > Link new repository > Create new connection
- Follow the authentication prompts to link your third-party Git provider
- Configure the networking settings if your repository is hosted in a private network
- Verify the connection to enable automated syncing and version control for your SQLX files
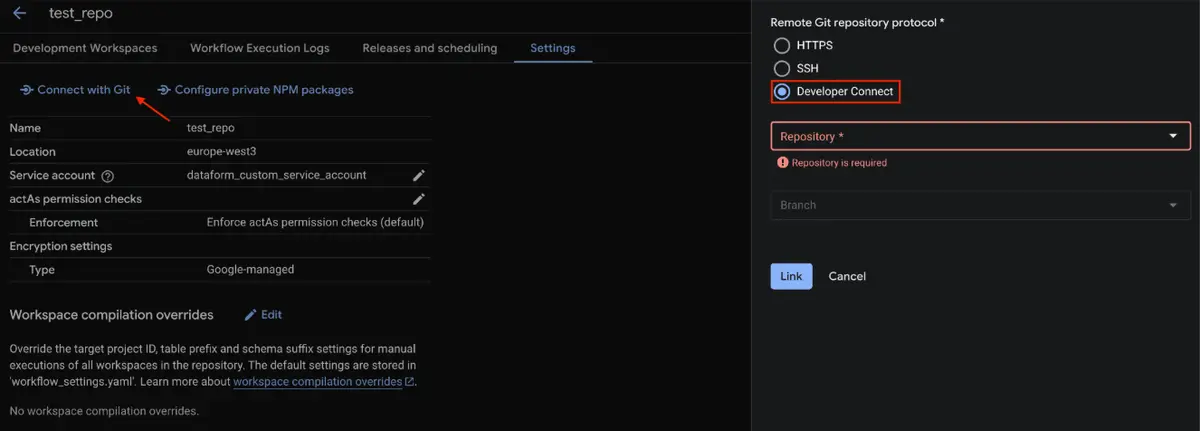
With this approach, you need to authorize Dataform once with your GitHub or GitLab account, and afterwards you just need to choose which repository you want to connect. More information can be found here.
Data Studio
BigQuery data agents
You can publish BigQuery data agents to Looker Studio now. This integration enables the use of Conversational Analytics within your dashboards, allowing stakeholders to interact with data using natural language.
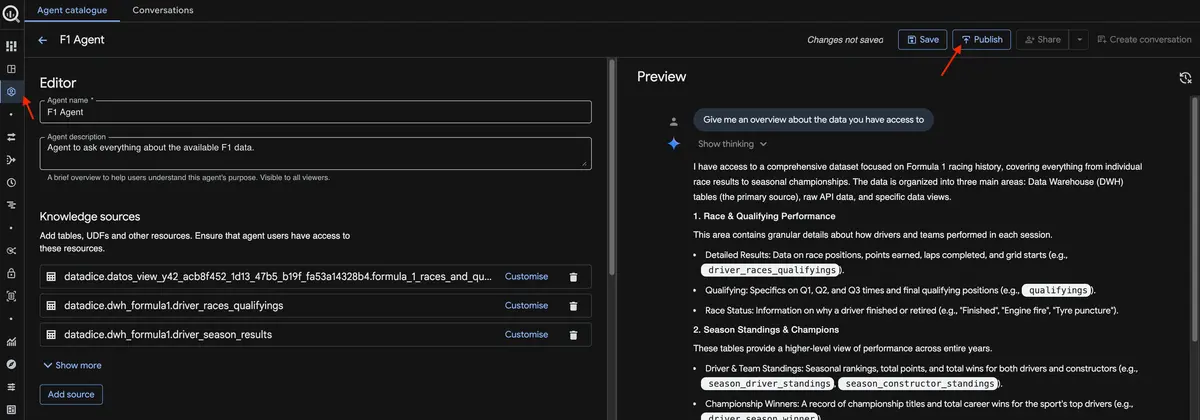
To enable this feature:
- Create a data agent within BigQuery.
- Use the automated publishing option to send the agent to Looker Studio.
- Access the agent within your Looker Studio report to begin using Conversational Analytics.
Furthermore, Conversational Analytics is now available to all users (not just for the Pro version).
More information about the BigQuery data agents creation can be found here, and about the new Conversational Analytics here.
Google Analytics
Task Assistant
The Task Assistant is a new menu to provide tailored recommendations for optimizing Google Analytics property configurations and improving data collection. The Task Assistant is in the left navigation menu, above the admin area.
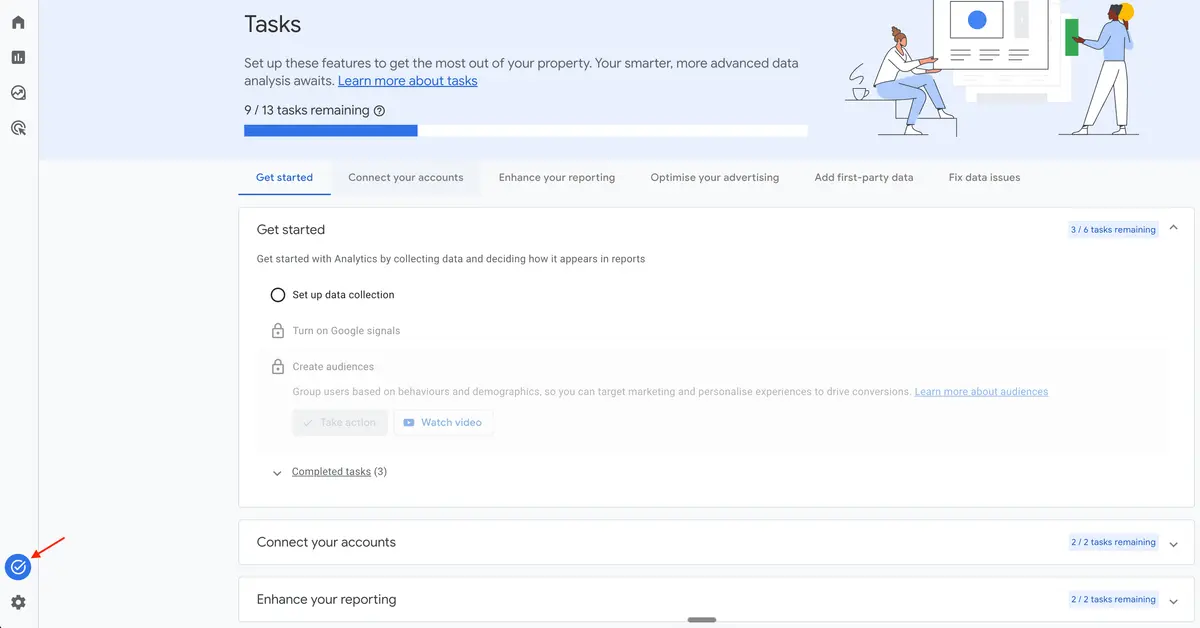
The tasks are grouped in the following sections:
- Get started: Basic setups like Data collection, Google signals, audiences, Key events
- Connect your accounts: Google Ads and Search Console link
- Enhance your reporting: Custom insights and audiences
- Optimise your advertising: Google Ads actions
- Add first-party data: user data, campaign data, measurement protocol
- Fix data issues: If Google Analytics recognizes data issues, potential fixes are shown
More information can be found here.
Google Tag Manager
No further release for Google Tag Manager.
Further Links
This post is part of the Google Data Analytics series from datadice and explains to you every month the newest features in BigQuery, Data Studio, Google Analytics, and Google Tag Manager.
Check out our LinkedIn account to get insights into our daily working life and get important updates about BigQuery, Data Studio, and marketing analytics.
We also started with our own YouTube channel. We talk about important DWH, BigQuery, Data Studio, and many more topics. Check out the channel here.
If you want to learn more about how to use Google Data Studio and take it to the next level in combination with BigQuery, check our Udemy course here.
If you are looking for help to set up a modern and cost-efficient data warehouse or analytical dashboards, send us an email to hello@datadice.io, and we will schedule a call.