In this blog post, I want to summarize the new releases from the Google tools that we use daily in datadice. Therefore, I want to give an overview of the new features of BigQuery, Dataform, Data Studio, Google Analytics, and Google Tag Manager. Furthermore, I will focus on the releases that I consider to be the most important ones, and I will also name some other changes that were made.
If you want to take a closer look, here you can find the Release Notes from BigQuery, Dataform, Data Studio, Google Analytics & Google Tag Manager.
BigQuery
New Conversation analytics feature
Conversational Analytics in BigQuery lets users analyze data using natural language. Instead of writing complex SQL statements manually, users can ask direct questions about their datasets in a chat interface, and the AI automatically translates these prompts into executable SQL queries.
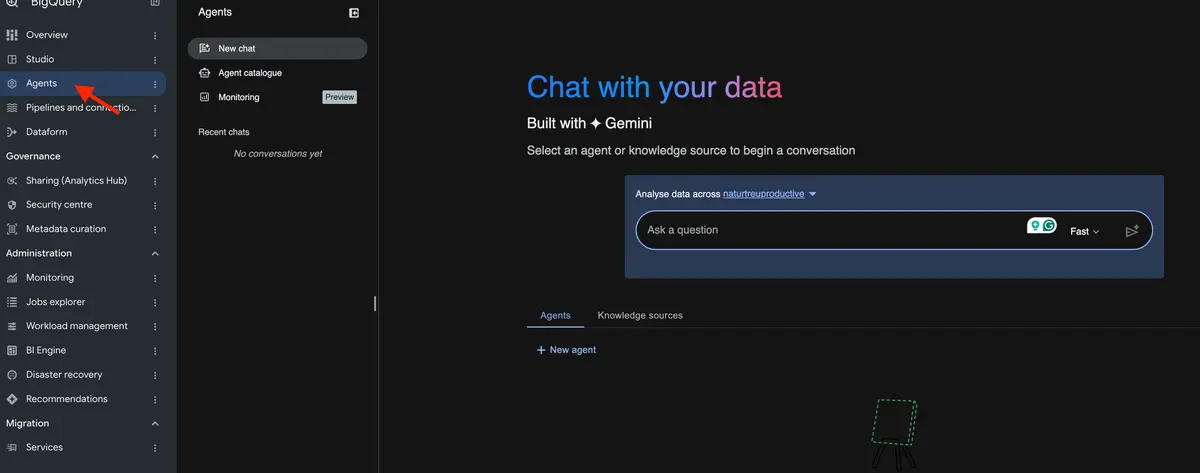
The latest update introduces several advanced analytical capabilities to Conversational Analytics:
- Utilize the AI.PREDICT function to forecast outcomes.
- Market basket analysis to uncover product associations
- The ML.CORRELATION function to calculate statistical correlations between a target column and one or more metric columns in a table
More information can be found here.
ML.METRICS function
BigQuery now provides the ML.METRICS function to compute evaluation metrics for classification and regression tasks directly on any table or query containing actual and predicted values. This allows you to evaluate machine learning performance metrics (precision, recall, accuracy, ROC AUC, or MAE) without needing to create, train, or reference a stored BigQuery ML model.
Example query evaluating a binary classification output:
SELECT *
FROM ML.METRICS(
  (
    SELECT
      actual_churn,
      predicted_churn
    FROM `project.dataset.customer_predictions`
  ),
  actual_label_column => 'actual_churn',
  predicted_label_column => 'predicted_churn'
)
Steps to evaluate predictions using ML.METRICS:
- Prepare a table or query containing both your actual ground truth labels and predicted values.
- Call the ML.METRICS function with the dataset or subquery as the input table.
- Define the actual_label_column and predicted_label_column parameters in the function call.
- Execute the SQL query in the BigQuery editor to view the generated evaluation metrics table.
More information can be found here.
Publish BigQuery data agent
BigQuery data agents can now be published directly to Gemini Enterprise by registering the agent with Agent Registry and importing it using default Google-managed credentials. When BigQuery and Gemini Enterprise reside in the same Google Cloud project and share a matching Agent Gateway region, there is no need to manage further credentials.
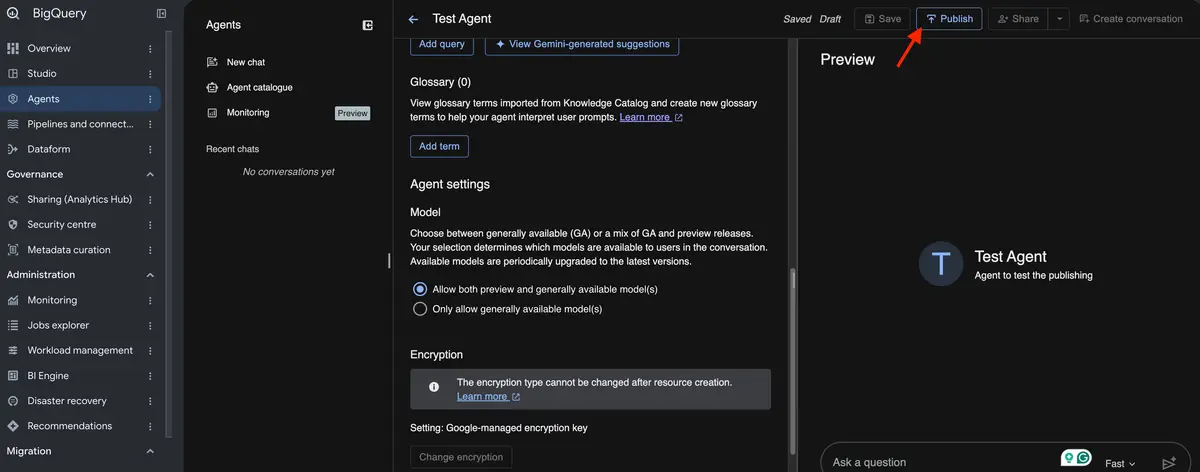
More information and a step-by-step guide for publishing can be found here.
WHERE clause in aggregate functions
BigQuery now allows you to include a WHERE clause directly inside an aggregate function call.
Example 1: Calculating total revenue for completed orders
WITH sales_data AS (
SELECT 1 AS order_id, 150.00 AS amount, 'completed' AS status    UNION ALL
SELECT 2 AS order_id, 50.00 AS amount, 'pending' AS status UNION ALL
SELECT 3 AS order_id, 200.00 AS amount, 'completed' AS status UNION ALL
  	SELECT 4 AS order_id, 99.99 AS amount, 'refunded' AS status
)
SELECT
SUM(amount WHERE status = 'completed') AS total_completed_revenue
FROM sales_data;
Result: total_completed_revenue = 350, because two orders are completed (150 + 200)
Example 2: Counting active users and their total logins
WITH user_data AS (
SELECT 'Alice' AS user_name, TRUE AS is_active, 12 AS logins UNION ALL
SELECT 'Bob' AS user_name, FALSE AS is_active, 3 AS logins UNION ALL
  	SELECT 'Charlie' AS user_name, TRUE AS is_active, 25 AS logins
)
SELECT
COUNT(user_name WHERE is_active = TRUE) AS active_user_count,
SUM(logins WHERE is_active = TRUE) AS active_user_total_logins
FROM user_data;
Result: active_user_count = 2 and active_user_total_logins = 37
More information can be found here.
Small changes
As usual, I want to mention some further changes at the end:
- OBJ.LIST function: perform analysis of unstructured data using the new OBJ.LIST function, which returns file metadata and ObjectRef values without requiring a persistent object table, enabling you to pass Cloud Storage objects into AI functions for structured ETL workflows. More information can be found here.
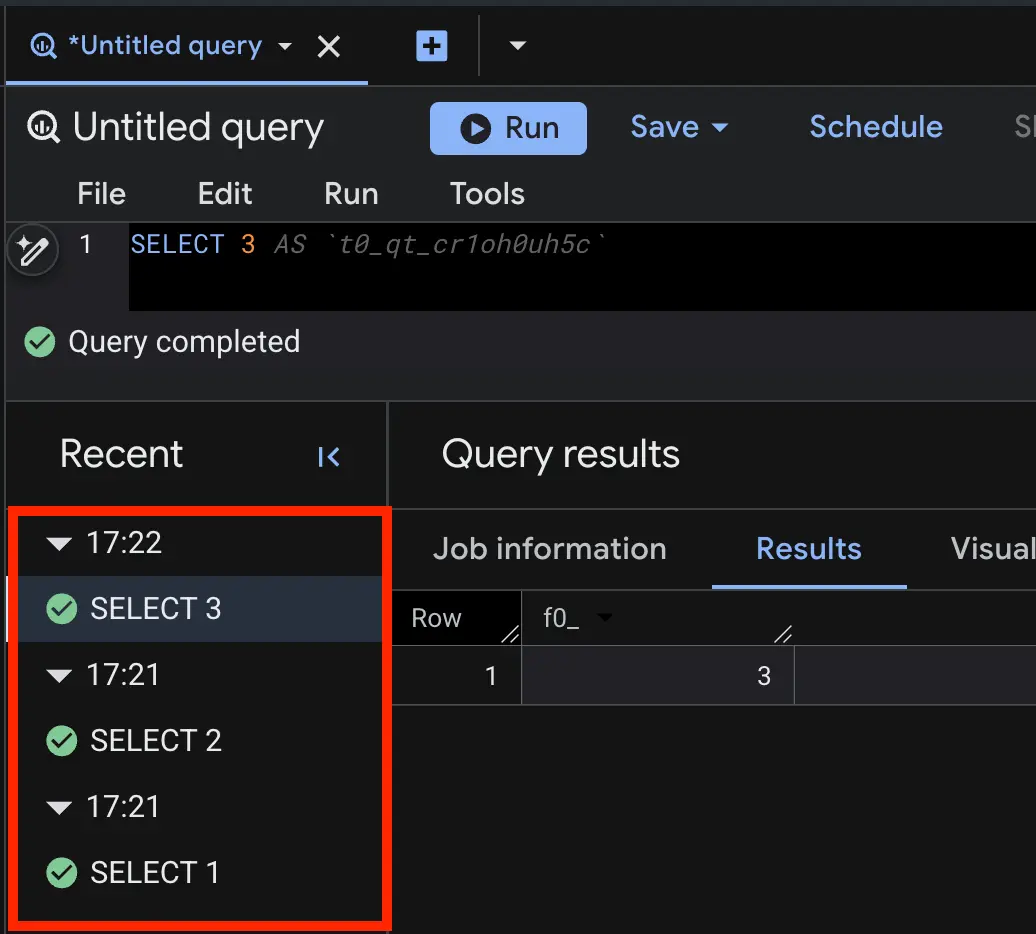
- History in Query results pane: The Query results pane in the BigQuery Studio query editor now displays a short history of recent runs directly within the editor interface
- BigQuery Security Center: The BigQuery Security Center provides a dedicated environment to evaluate your organization's data security profile, configure row- and column-level security policies, and manage data governance rules alongside policy tags. More information can be found here.
- AI.CAUSAL_EFFECT function: Quantify the impact of specific interventions on time series data by comparing actual post-intervention results against an estimated counterfactual baseline generated via univariate ARIMA_PLUS forecasting, supporting automated time series segmentation to evaluate absolute/relative effects and statistical significance, as well as parallel processing across multiple series without requiring control groups or external covariates. More information can be found here.
- Migration lineage service: When planning a BigQuery data warehouse migration, you can now use the migration lineage service to generate a graph that visually maps out how data moves through your source system and how each table or view is connected, offering support for source dialects that include Amazon Redshift SQL, Snowflake SQL, Teradata SQL, and GoogleSQL. More information can be found here.
Dataform
Unit tests
Dataform now supports unit tests to validate workflow actions against mock data with expected result sets. Defined in dedicated .sqlx files, unit tests isolate and mock all dependencies (tables, views, declarations, …) to ensure correct SQL transformation. Dataform executes the action logic against the mock input and compares the output row-by-row with your expected result query.
Steps to create and run unit tests in Dataform:
- Create a new .sqlx file within your Dataform workspace (e.g., in a tests/ directory).
- Add a config block setting type: "test" and specify the target model name in the dataset field.
- Define one or more input blocks named after the referenced dependencies, using SELECT statements combined with UNION ALL to supply mock data rows.
- Define the expected output query at the bottom of the .sqlx file to represent the intended transformation output.
- Run compilation and trigger the unit test to verify that the generated results match the expected rows.
At first, you need to define the model, which you want to test afterwards:
config {
type: "table",
name: "product_revenue"
}

SELECT
  c.product_name,
  SUM(o.gross_revenue) AS product_gross_revenue
FROM ${ref("product_date")} c
LEFT JOIN (
  SELECT
    product_sku,
    record_date,
    SUM(product_gross_revenue_after_discount) AS gross_revenue
  FROM ${ref("order_item")}
  GROUP BY 1,2
) AS o
  ON c.product_sku = o.product_sku
  AND c.record_date = o.order_date
GROUP BY 1, 2
An example unit test defined in a .sqlx file:
config {
  type: "test",
  dataset: "product_revenue"
}

input "product_date" {
  SELECT 'SKU-123' AS product_sku, 'Laptop' AS product_name, DATE '2026-10-13' AS record_date
}

input "order_item" {
  SELECT 'SKU-123' AS product_sku, DATE '2026-10-13' AS record_date, DATE '2026-10-13' AS order_date, 800.00 AS product_gross_revenue_after_discount
  UNION ALL
  SELECT 'SKU-123' AS product_sku, DATE '2026-10-13' AS record_date, DATE '2026-10-13' AS order_date, 200.00 AS product_gross_revenue_after_discount
}

-- Expected output
SELECT 'Laptop' AS product_name, 1000.00 AS product_gross_revenue
More information can be found here.
Updates on MCP server
There are a few updates available for the Dataform MCP server:
- Pipeline authoring: Build and edit pipelines directly within development workspaces.
- Workspace management: Create and list development workspaces.
- File navigation and editing: Search and modify files across repositories.
- Git operations: Commit changes and push commits directly to remote Git providers.
- Repository settings: Update and adjust repository configurations.
- Folder organization: Structure and organize repositories into folders.
Data Studio
PostgreSQL connect via IP Address
Looker Studio now supports connecting directly to PostgreSQL databases hosted on Cloud SQL using a private IP address. Utilizing private IP connections keeps your database traffic strictly on a secure, private network instead of exposing it over the public internet.
More information can be found here.
Google Analytics
Dashboards
Dashboards are now natively available in Google Analytics, providing a way for businesses to view their KPIs on a custom, single report. These new dashboard features are very close to the functionalities of Data Studio.
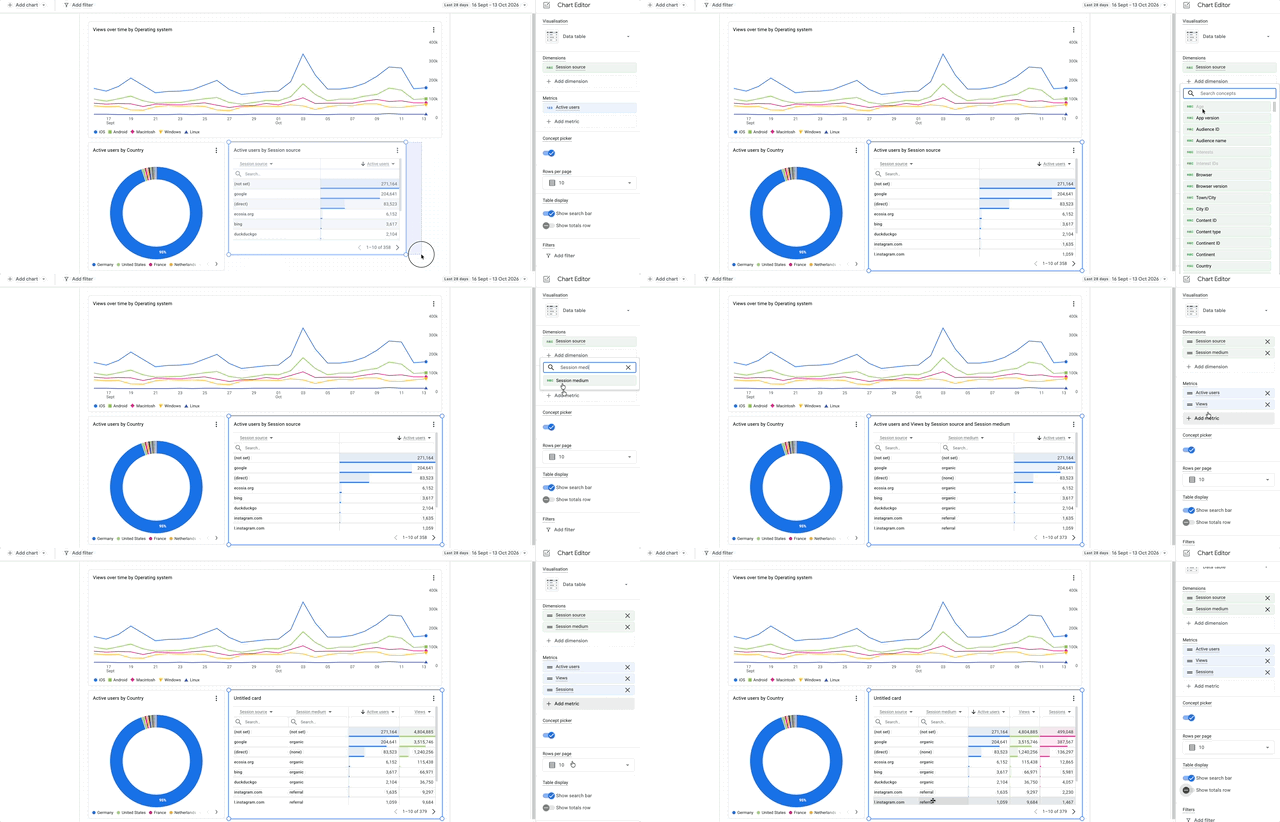
Steps to create and publish a dashboard in Google Analytics:
- Log in to Google Analytics and select Reports from the left navigation menu.
- Click “Create new report” > “Create Dashboard”.
- Click on “Add chart” and choose a chart type.
- Select the dimensions and metrics
- Adjust chart configurations or filters
- Set a name and click on Save to store the dashboard
- Add the dashboard to a collection so it is part of your navigation.
Now you can really create your own customized reports in Google Analytics! I am pretty sure this feature will get more updates in the future because, so far, it is quite limited, but a really good starting point.
More information can be found here.
Include Hostname filter
Following the general introduction of hostname filtering on June 11, 2026, Google Analytics now supports include data filters for hostnames. Information about the hostname filter in general can be found here. This new update allows you to define an allowlist of approved domains authorized to send event data to your property.
Note:
- Events with an empty hostname will always be blocked
- Traffic sent via the Measurement Protocol remains unblocked
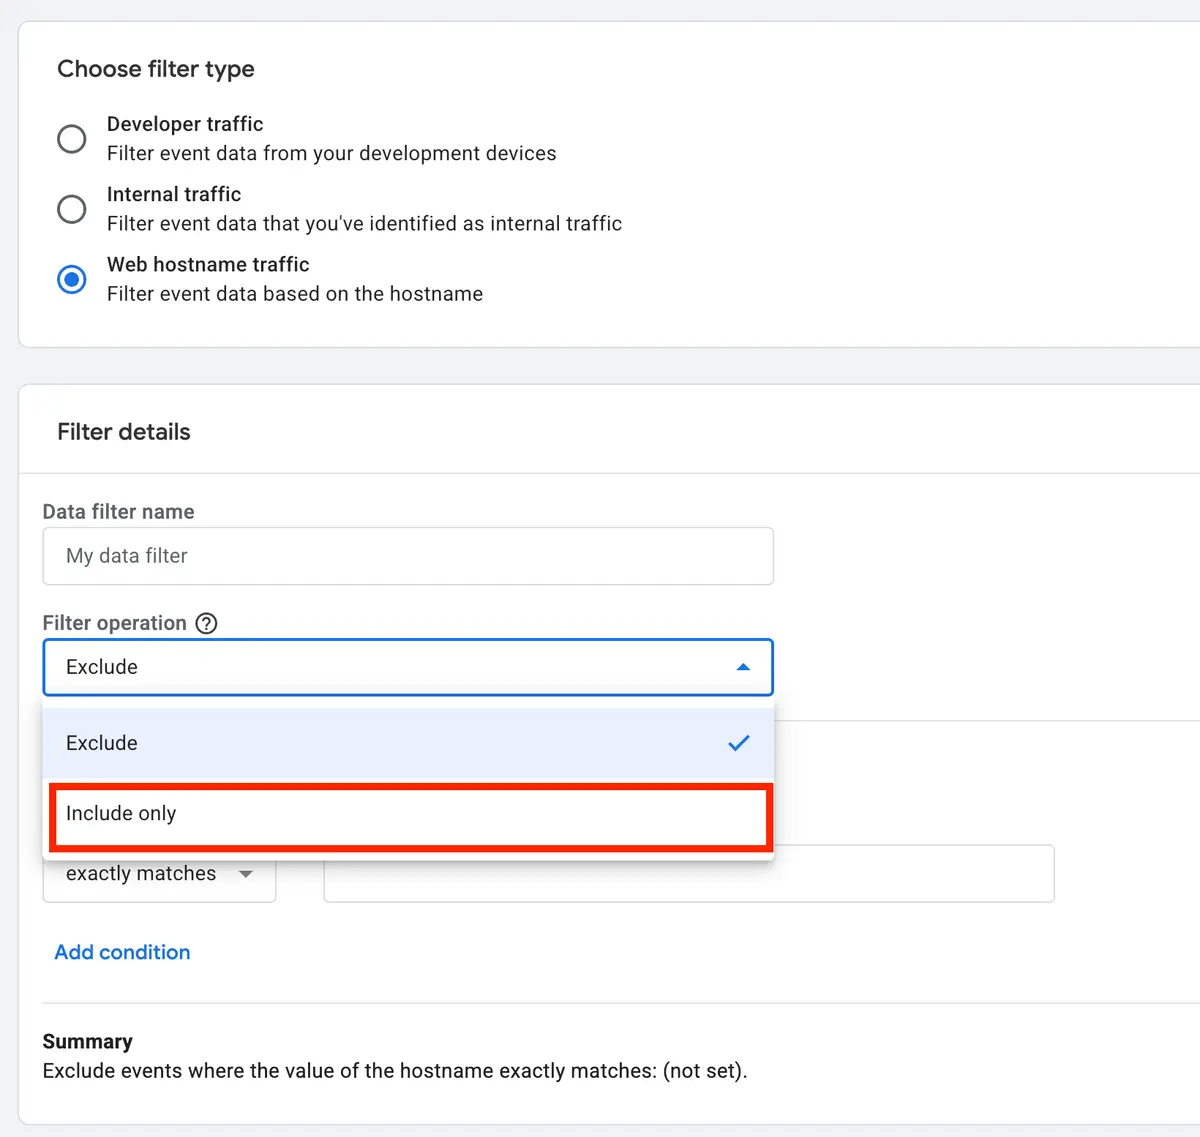
Steps to set up a hostname include filter:
- Log in to Google Analytics and navigate to the Admin panel.
- Under Data collection and modification, click on “Data Filters”.
- Click “Create Filter” and select “Web Hostname filter”.
- Set the filter operation to “Include only” and define your list of approved hostnames/domains.
- Select Testing or Active and create the filter
Google Tag Manager
AI version summary
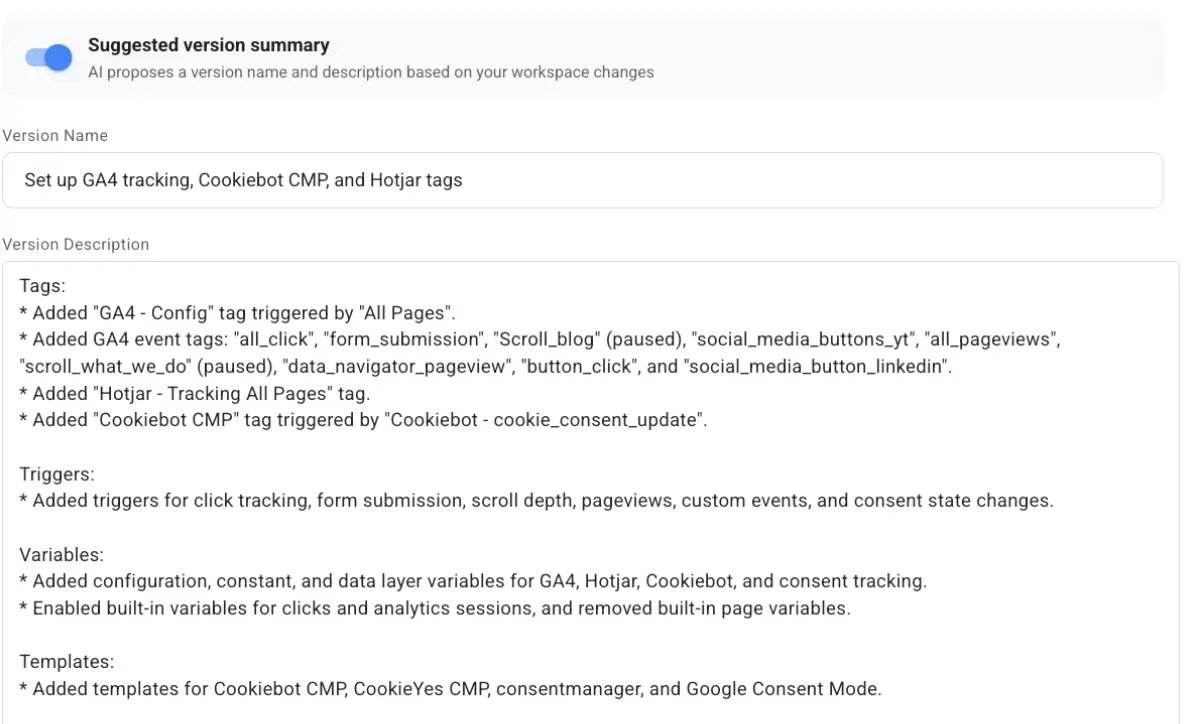
A small but nice feature and good use case for AI support!
Google Tag Manager now features AI-suggested version summaries directly on the container submission page. When submitting a workspace, an integrated AI automatically evaluates all recent workspace edits (modified tags, updated triggers, new variables, …). Then generates a proposed Version Name and Version Description.
How to use AI-suggested version summaries:
- Make the required tracking or container updates in your Google Tag Manager workspace.
- Click the Submit button in the top-right corner of the GTM interface.
- View the automatically populated Version Name and Version Description on the submit page.
- Review and edit the suggested text to add any required business context, author details, or ticket links.
- Click Publish to finalize and publish the new container version.
Further Links
This post is part of the Google Data Analytics series from datadice and explains to you every month the newest features in BigQuery, Data Studio, Google Analytics, and Google Tag Manager.
Check out our LinkedIn account to get insights into our daily working life and get important updates about BigQuery, Data Studio, and marketing analytics.
We also started with our own YouTube channel. We talk about important DWH, BigQuery, Data Studio, and many more topics. Check out the channel here.
If you want to learn more about how to use Google Data Studio and take it to the next level in combination with BigQuery, check our Udemy course here.
If you are looking for help to set up a modern and cost-efficient data warehouse or analytical dashboards, send us an email to hello@datadice.io, and we will schedule a call.