In this blog post, I want to summarize the new releases from the Google tools, that we use daily in datadice. Therefore I want to give an overview of the new features of BigQuery, Dataform, Looker Studio, Google Analytics and Google Tag Manager. Furthermore, I will focus on the releases that I consider to be the most important ones and I will also name some other changes that were made.
If you want to take a closer look, here you can find the Release Notes from BigQuery, Dataform, Looker Studio, Google Analytics & Google Tag Manage.
BigQuery
New Data Transfers
BigQuery offers the possibility to add certain raw data to your BigQuery project. It started with the Google services like Google Ads and YouTube.
Google adds new transfers step by step and these were added now:
- Facebook Ads
- Oracle
- Salesforce
- Salesforce Marketing Cloud
- ServiceNow
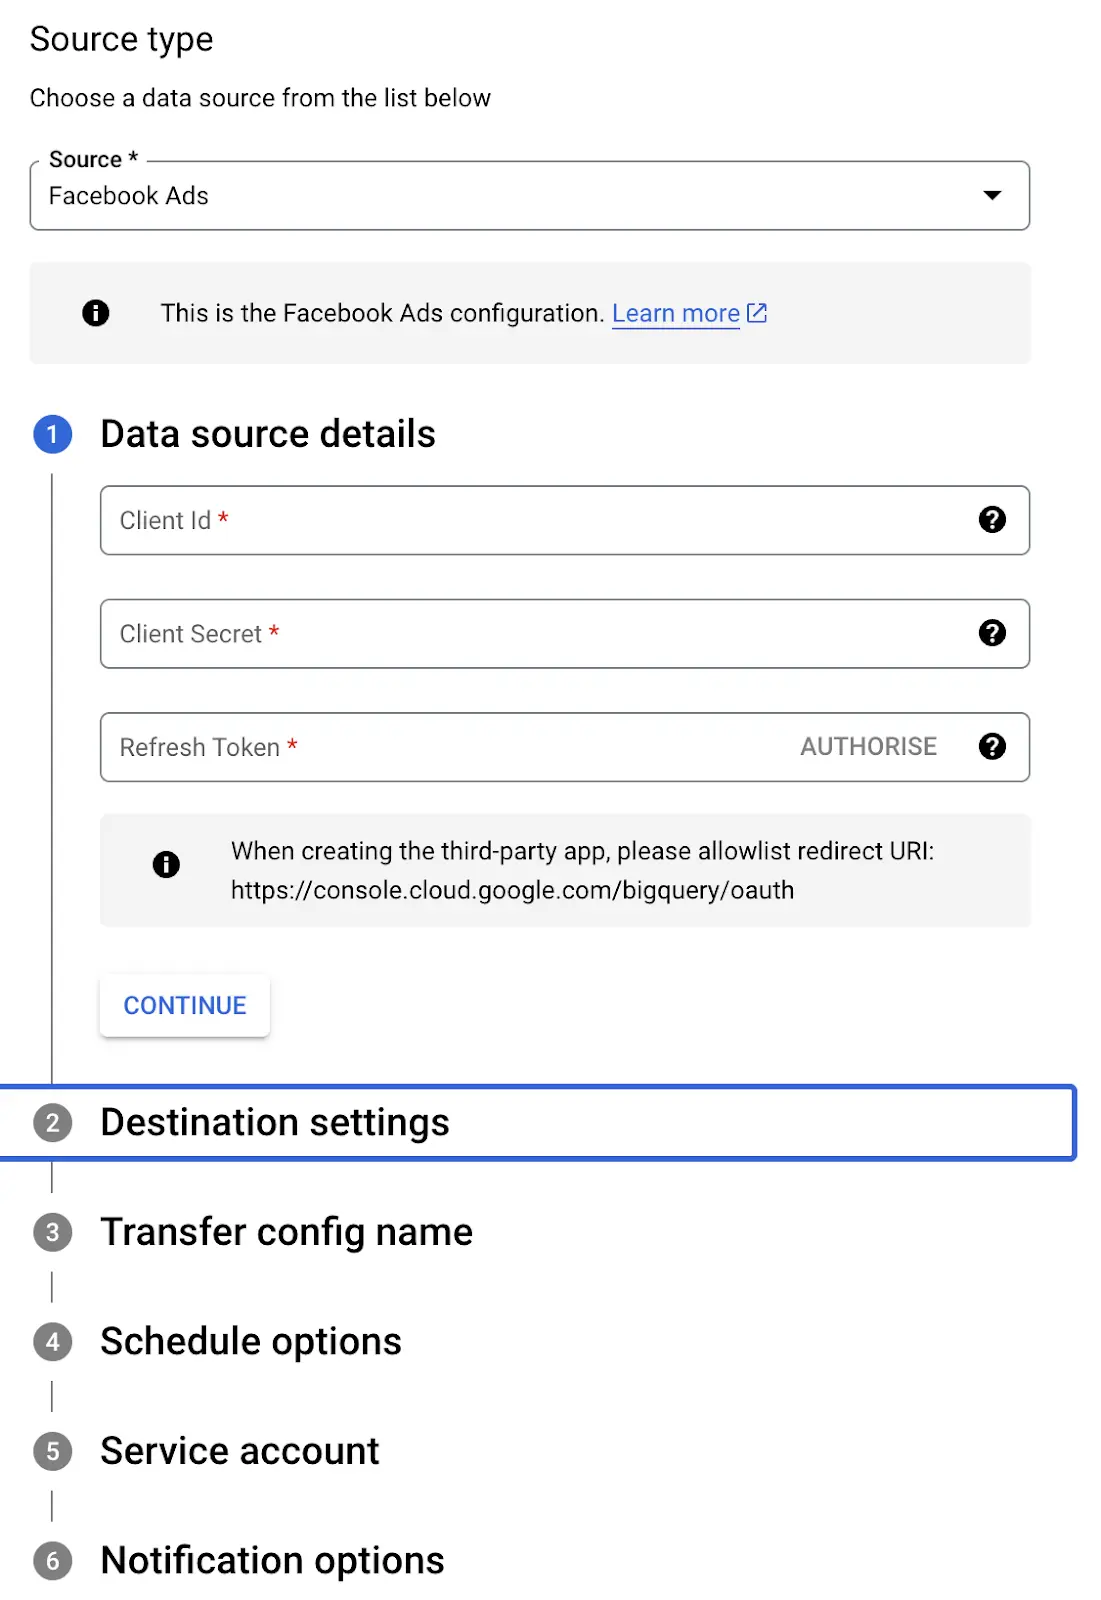
After choosing the transfer you have to add all the needed authorization information and set up further configurations. This is for example the configuration for Facebook Ads:
DML DELETE for Partitions
You can separate your tables into different parts, called partitions. This is important for cost-saving operations, to not read for every query the full table, but instead single partitions.
Now you can even delete single partitions with the DML DELETE statement.
Example query:
DELETE dataset_name.table_nameWHERE _PARTITIONDATE IN ('2005-05-10','2005-05-11');
Further changes
There are a lot of additional changes:
- New framework entity resolution available
- Creating a remote model or generating text with the gemini-pro Vertex AI LLM
- Add time series and range functions to time-series analysis
- ARIMA_PLUS_XREG can perform anomaly detection
- A lot of cross-cloud materialized view improvements
Dataform
No further release for Dataform.
Looker Studio
Table: Column description (No Pro)
You can add descriptions to columns of tables in your dashboard now. The user sees the description by hovering over the “i” sign.
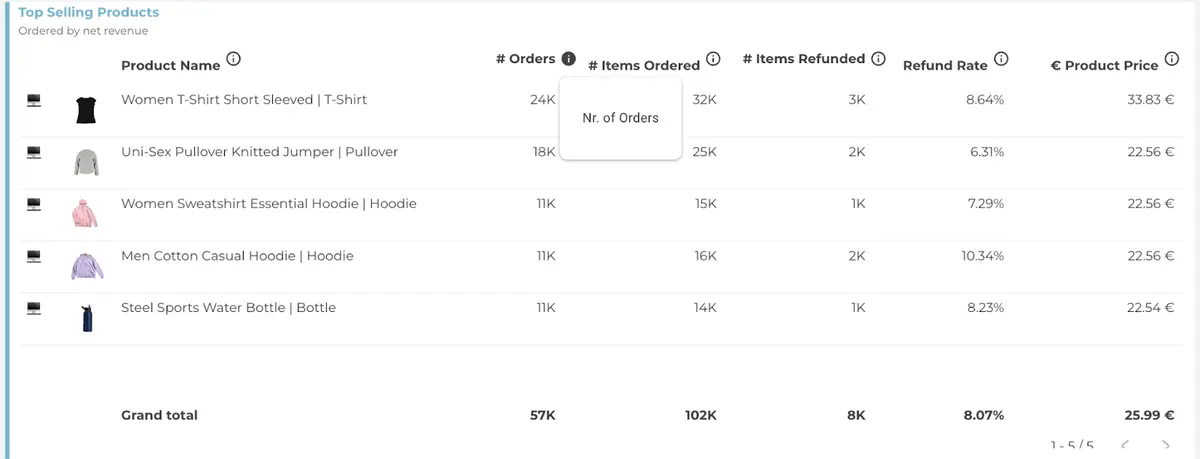
At first, you have to add the descriptions for these fields in the datasource
- In the dashboard click on “Resource > Manage added data sources”
- Select the correct datasource and click on “Edit”
- Type the description for the needed fields
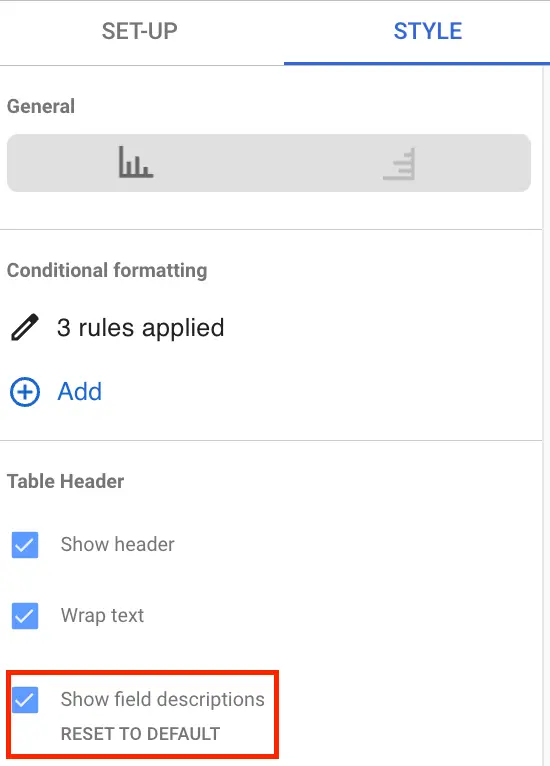
Then you have to select for each table if you want to show these descriptions or not:
- Click on the table
- In the Style section, click on “Show field descriptions”
Problems/Limitations:
- The positioning and look of the tooltip symbols could be better and will be hopefully improved in the next updates
- In the edit mode, it is looking even worse
- The feature is (so far) just available for tables, but could be added to scorecards, filters and charts as well
Folders in team workspace (Pro)

You can add folders to your workspaces to have an additional layer of organization for reports and datasource.
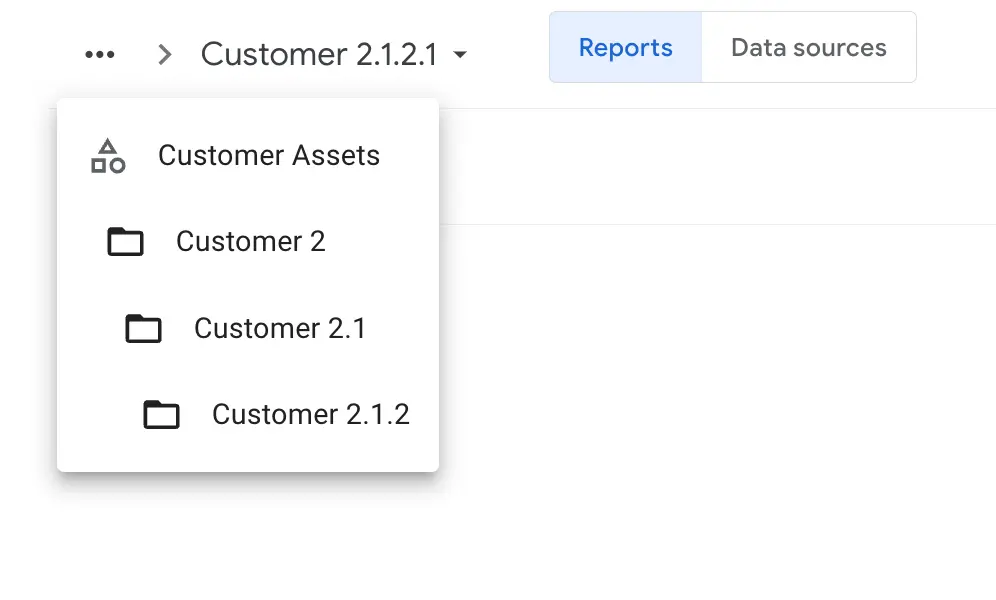
Even further folders can be added to folders.
Google Analytics
Primary Channel Group
You can set a channel group as the primary channel group now. This you can do in the admin part of your property.

This channel group will be selected by default for the corresponding reports.
Advertising reports
There is a completely new section available for the whole Advertising part, next to Home, Reports and Exploration.
The section gets filled based on the marketing channels you connected with the GA4 property. If you have not connected one of the following services:
- Google Ads
- Floodlight
- Search Ads
- Display & Video
- AdSense
- Ad Manager
- AdMob
the following screen appears:
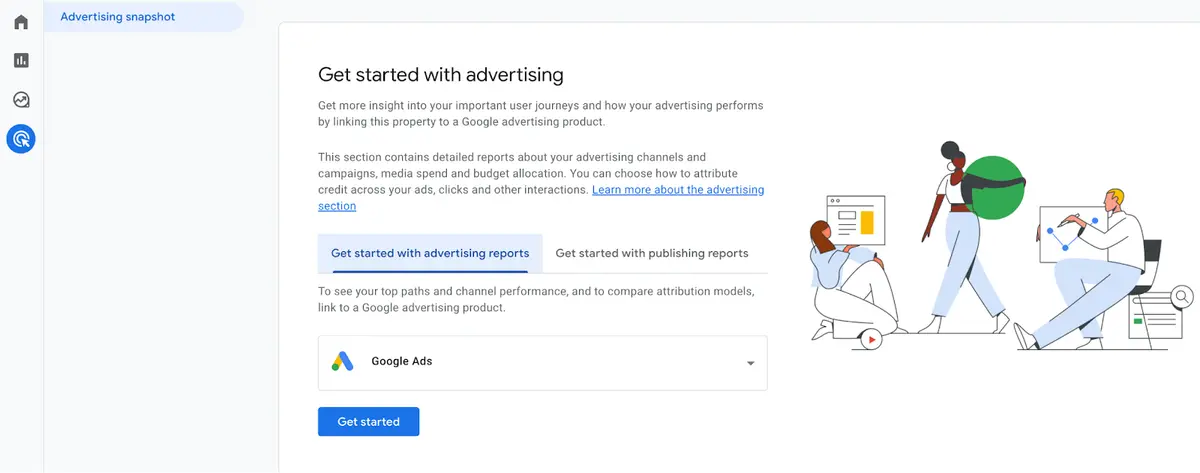
Based on the services you connected, you get the corresponding data reports shown.
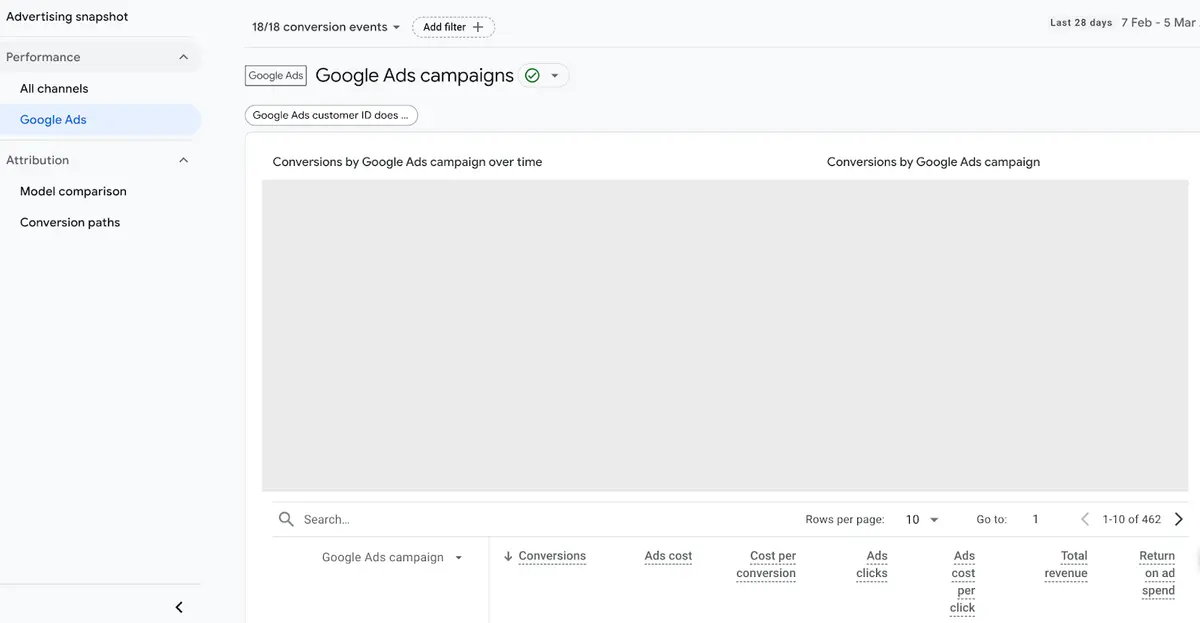
Trend Change detection
GA4 has a lot of different ways to present the data and on the home and overview pages, it shows these “Insights” charts. This kind of chart mentions important behavior in your data.
There is a new type of insight chart available, the trend detection. It is the opposite of the anomaly detection chart.
- Anomaly detection: show spikes in data
- Trend detection: show slow but steady changes in the data
So far I have looked at some properties I have access to and did not find any trend detection chart, maybe it still needs time, until it shows up.
Google Tag Manager
No further release for the Google Tag Manager.
Further Links
This post is part of the Google Data Analytics series from datadice and explains to you every month the newest features in BigQuery, Data Studio, Google Analytics and Google Tag Manager.
Follow us on LinkedIn for insights into our daily work and important updates on BigQuery, Data Studio, and marketing analytics.
Subscribe to our YouTube channel for discussions on Data Warehouse, BigQuery, Looker Studio, and Google Tag Manager.
If you are interested in learning BigQuery from scratch, get access to our free BigQuery Course
Elevate your skills with Google Data Studio and BigQuery by enrolling in our Udemy course.
Need help setting up a modern, cost-efficient data warehouse or analytical dashboard? Email us at hello@datadice.io to schedule a call.